
Google Search Console is a free tool offered by Google to website owners and creators. As well as being a means for Google to contact you in case it detects a problem with your WordPress site, it can also be used as an SEO tool to help you rank better in Google for your keywords.
In this chapter we will delve into how you can use data in Google Search Console track SEO performance over time and identify keywords you can optimize your site for.
Google Search Console Search results report
The main report to use for measuring SEO performance is the Search results page. To get here from the Overview Page you can click on Full report in the Performance graph at the top of the page or on Search results in the left-hand menu (the Performances section can also sometimes reduced to a single Performance link).
The default view for this page shows data for the last 3 months with the latest data usually being from 48 hours ago. You can’t see real-time data from today, nor accurate data from the previous day. In fact, the data for the last day in the graph may be inaccurate or incomplete. To analyze recent search engine traffic changes, you may be better using Google Analytics.
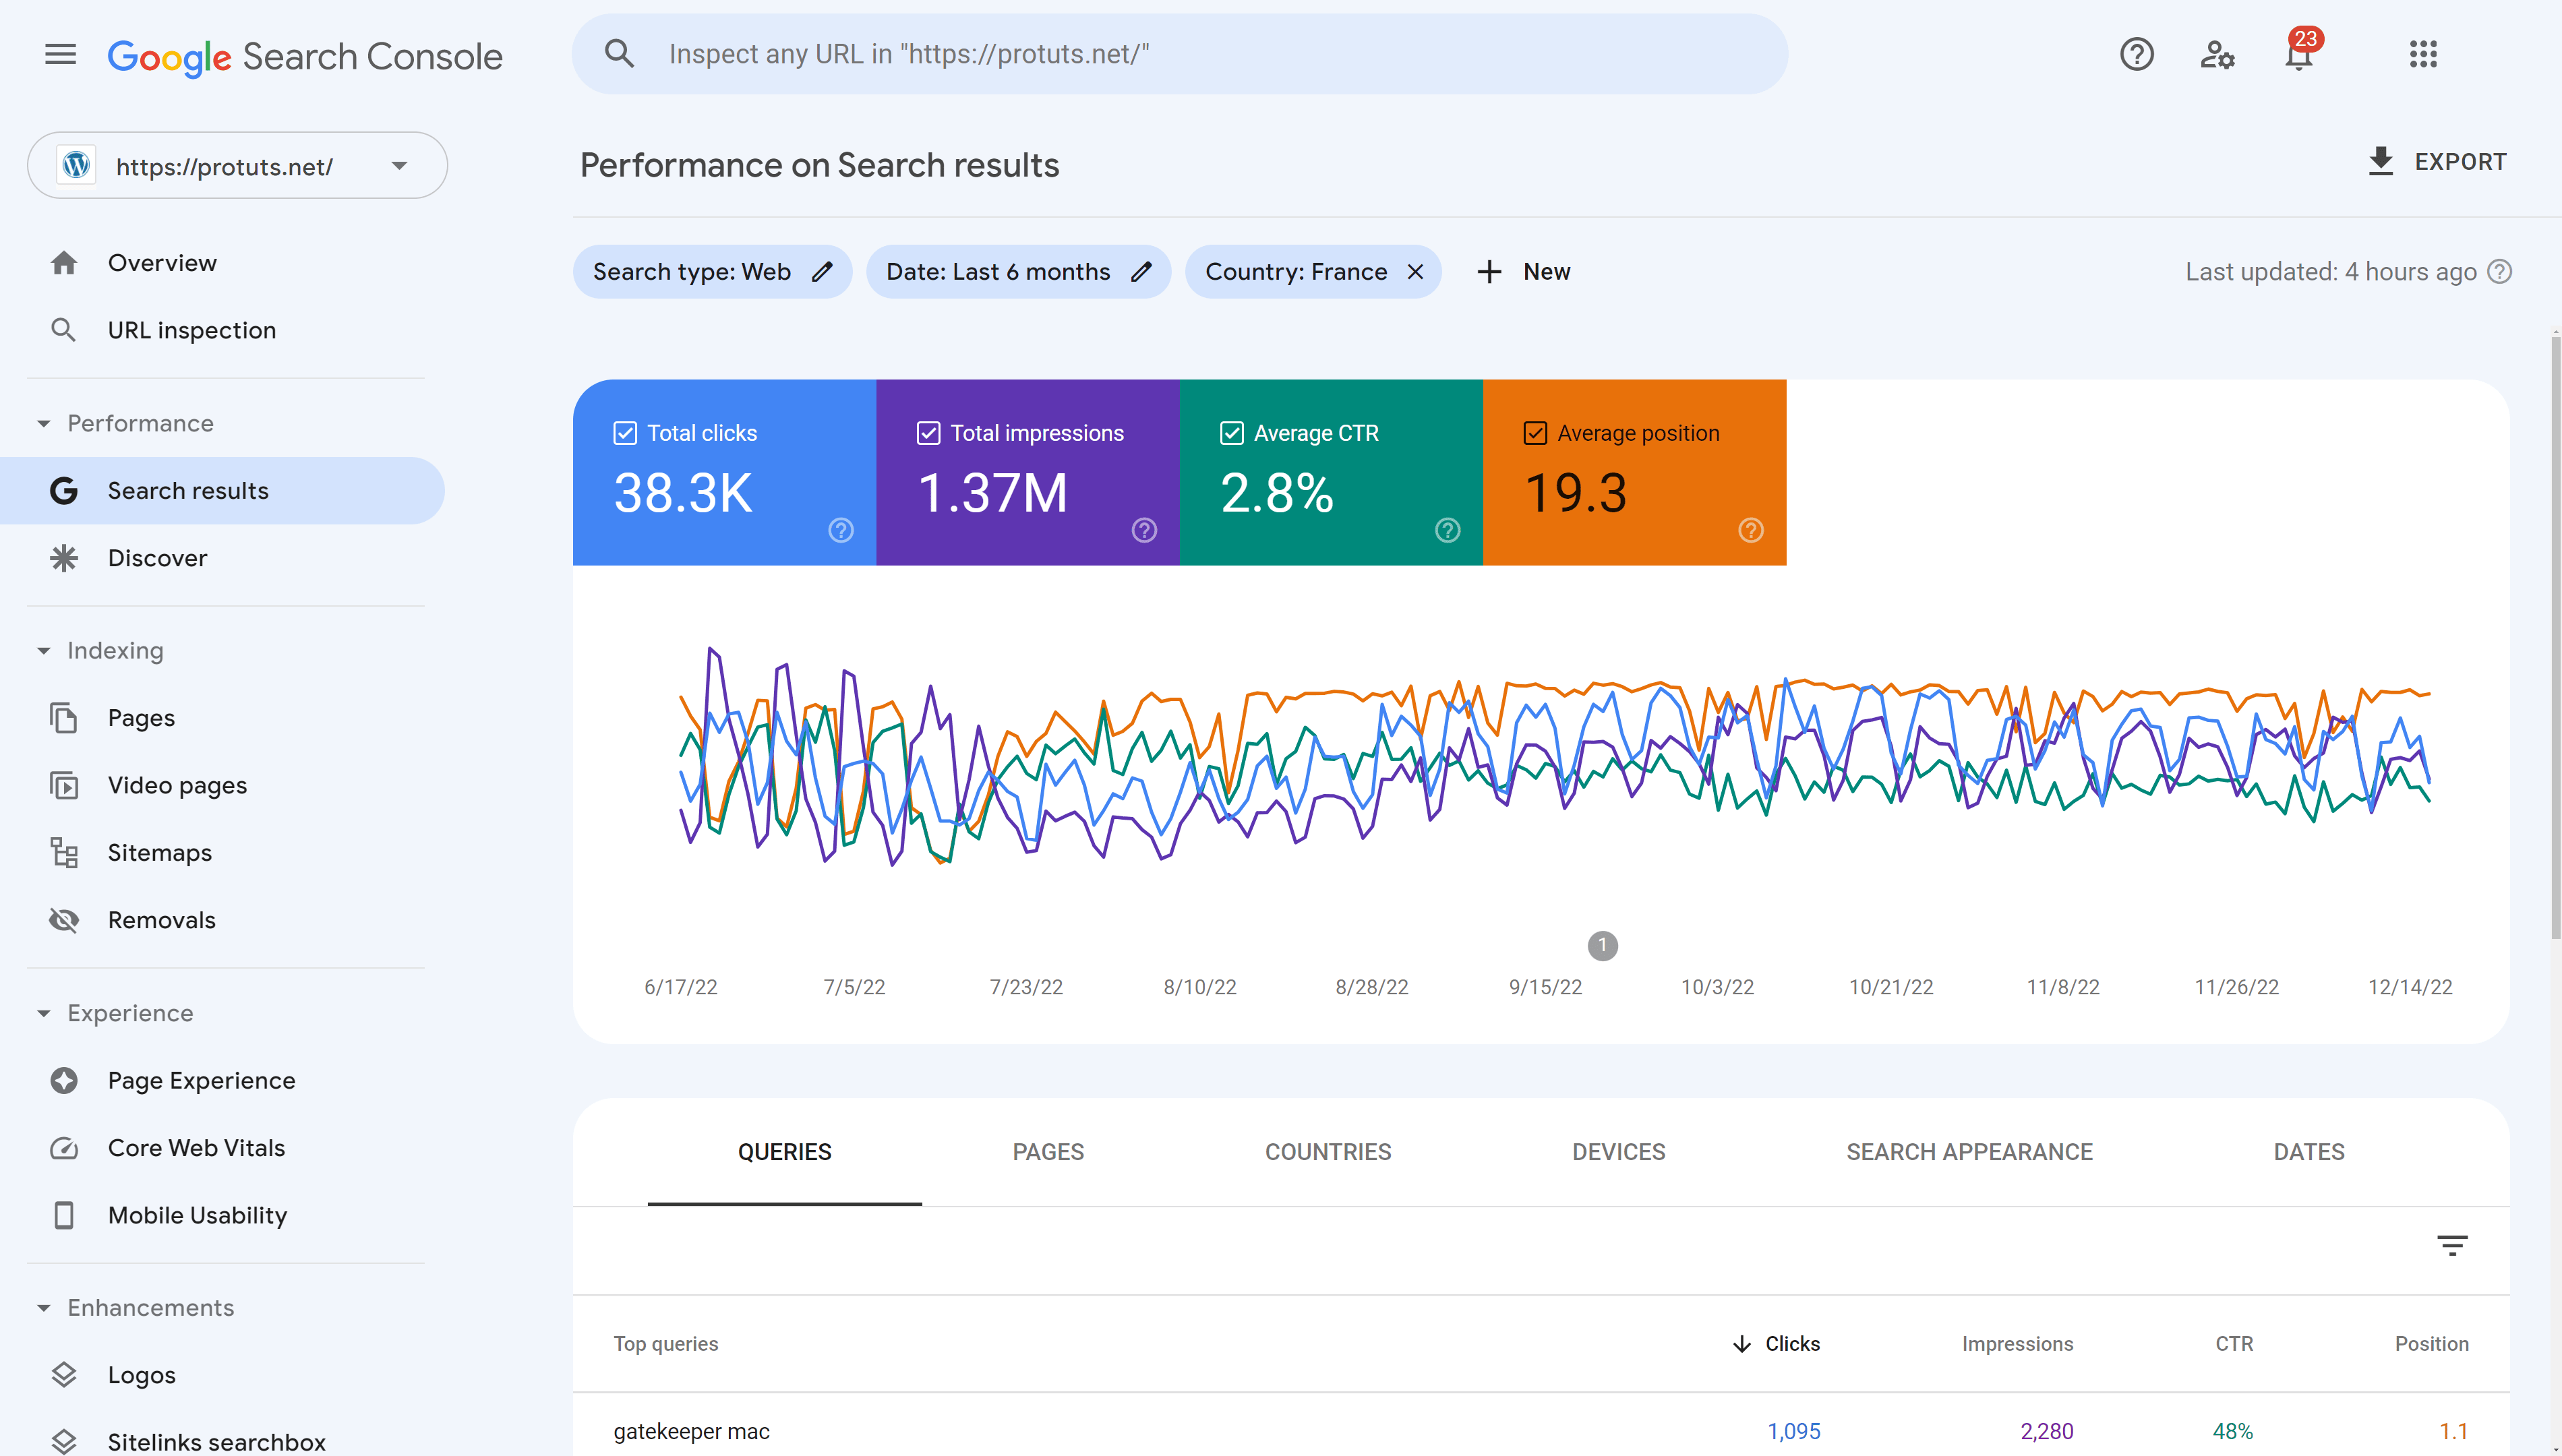
The first part of this report shows a graph plotting KPI over time. By clicking on the 4 KPI at the top of the graph, you can add or remove them from the graph. There must always be at least one KPI active.
Using the filters at the top of the page, you can also change the Search type, Date range and add other filters based on Query, Page, Country, Device or Search appearance.
If your website only targets one country, it will be a good idea to filter results for that country only before analyzing results. In the example above, we have extended the dates to 6 months and filtered the results to France only. You may also want to filter queries to include or exclude your brand name.
The report in the screen shot above shows
- 3K Total clicks – by passing your mouse over the blue block, you can see that the exact result is 38,343 clicks – 38.3K is shorthand for around 38.3 thousand. This means that Google generated 38,343 clicks to your website from users in France over the last 6 months (not counting paid ad clicks if you use Google Ads). The blue line in the graph plots this KPI over time. It clearly shows that the number of clicks goes down every weekend (by passing your mouse cursor along the line you can see the exact dates and the number of clicks) and that the number of clicks was down in July and August compared to June and September.
- 37M Total impressions – This KPI indicates that a link to your site appeared 1,372,045 (1.37 million) times in Google’s search results in France over the past 6 months. That is quite an impressive figure! The purple line in the graph corresponding to Impressions. It also goes down on weekends and during the summer holidays and this explains why the site got fewer clicks during weekends. We can conclude that relevant search queries for this site are mainly performed when people are at work.
- 8% Average CTR – While links to the site was shown 1,372,045 times, they were only clicked a total of 38,343 times. This is an average Click-Thru-Rate (CTR) of 2.8%. Although 2.8% is not necessarily a bad CTR for all the keywords your site is visible for, you can see that there is a big potential to increase traffic by increasing the Click-Thru-Rate! CTR has been fairly stable since August and there is no change at weekends, but there were some big variations from day to day between June and July.
- 3 Average position – Every time a link to your website is shown in Google’s results it is in a position from position 1 at the top of the page, position 2 the next link down and onwards to as many results a user could see. If your site has more than one link in search results, only the highest position is counted for each search. The average position is the site’s average position over many searches. Traditionally a first page of search results will contain at least 10 links ranked as positions 1 to 10. But some pages contain more than just the organic results and users can either scroll down or click onto page 2 or page 3 of results. In this case, the average position for the site is 19.3 indicating that the site is rarely in the best positions for all the queries it was visible for. Following the KPI over time we can see that there were big variations in June and July with average position varying from 15.6 to 39.1 from one day to the next.
These strange results in June and July serve to underline that the Average position KPI for all search queries is not a good overall performance indicator. In some cases, your site can be visible in very low positions for search queries that you are not interested in. This can have an important impact on Average position score in Google Search Console, showing a drop in ranking that is not true for your main keywords. The Average position KPI is best used in Google Search Console to analyze the position of individual queries.
To set up a useful rank checking KPI you will need to check ranking on a restricted number of keywords. You cannot do this with Google Search Console at the moment. See our article How to Track Keyword Rankings for more details on this. The best option is to use dedicated keyword tracking software. For WordPress sites, we recommend using the SEOPress Insights plugin.
Reviewing Search results in Google Search Console may show much more dramatic results. To illustrate this see a screenshot shared by SEO Brodie Clark that shows a site’s performance just after it was penalized by Google’s October 2022 Spam Update.
The brutal impact of Google's October 2022 Spam Update… Thankfully, this site owner understands where they went wrong with this specific domain. I don't necessarily think Google did the wrong thing, but the result is certainly devastating for the owner. pic.twitter.com/2iPUN9V7sy
— Brodie Clark (@brodieseo) October 27, 2022
Analyzing queries and detecting keywords
Moving down the Search results report for protuts.net, we can see a table containing queries as rows and the 4 KPI as columns. The KPI shown will depend on those selected above the graph. By default, this page shows the top 10 queries sorted by the number of clicks your site received. The query with the most clicks is at the top of the table.
Below the table, you see a selector that can be used increase the number of rows displayed per page of results from 10 to 500. You can only see the top 1000 results for any report.
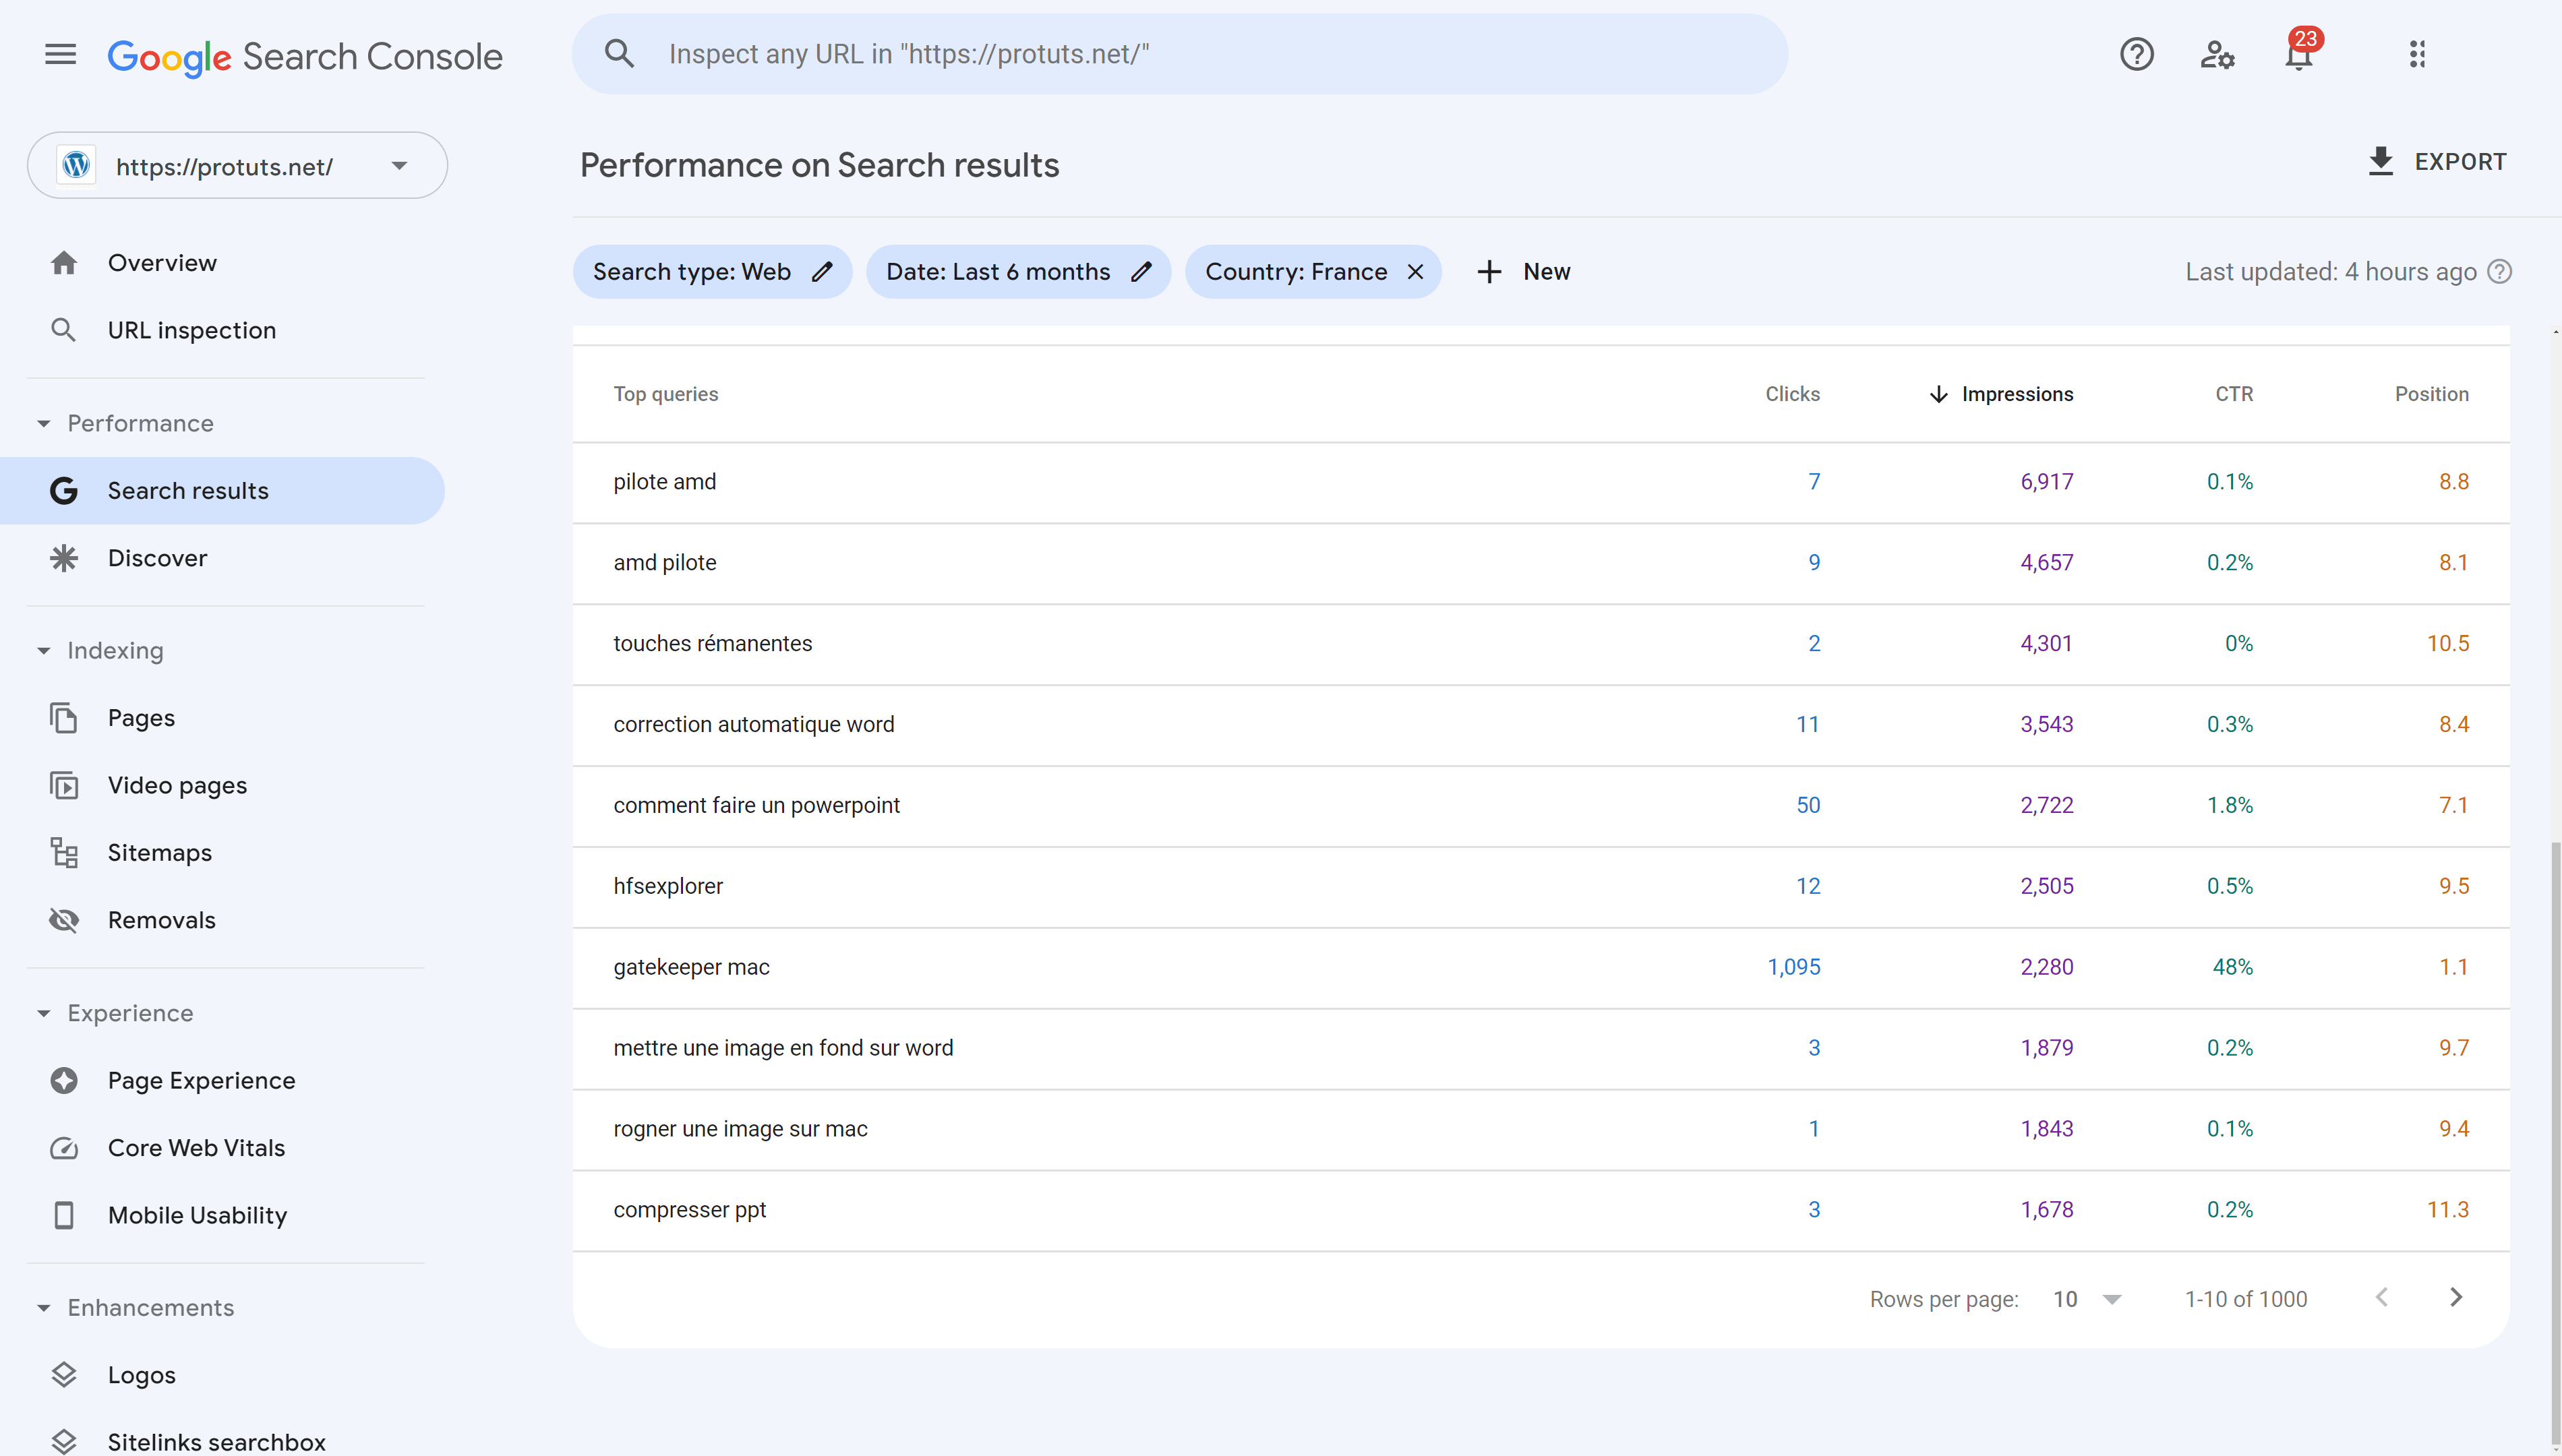
The top results, queries generating the most clicks to your website, will very likely be important keywords for your SEO. In the case of Protuts.net – a French website offering technical tips for PC, Linux and Mac – 6 of the top queries concern the Mac security feature Gate-keeper and more specifically how to deactivate it. For these keywords the site has an average position of 1 or 1.1.
This position can be checked in real time, if you are in France, by searching on Google.
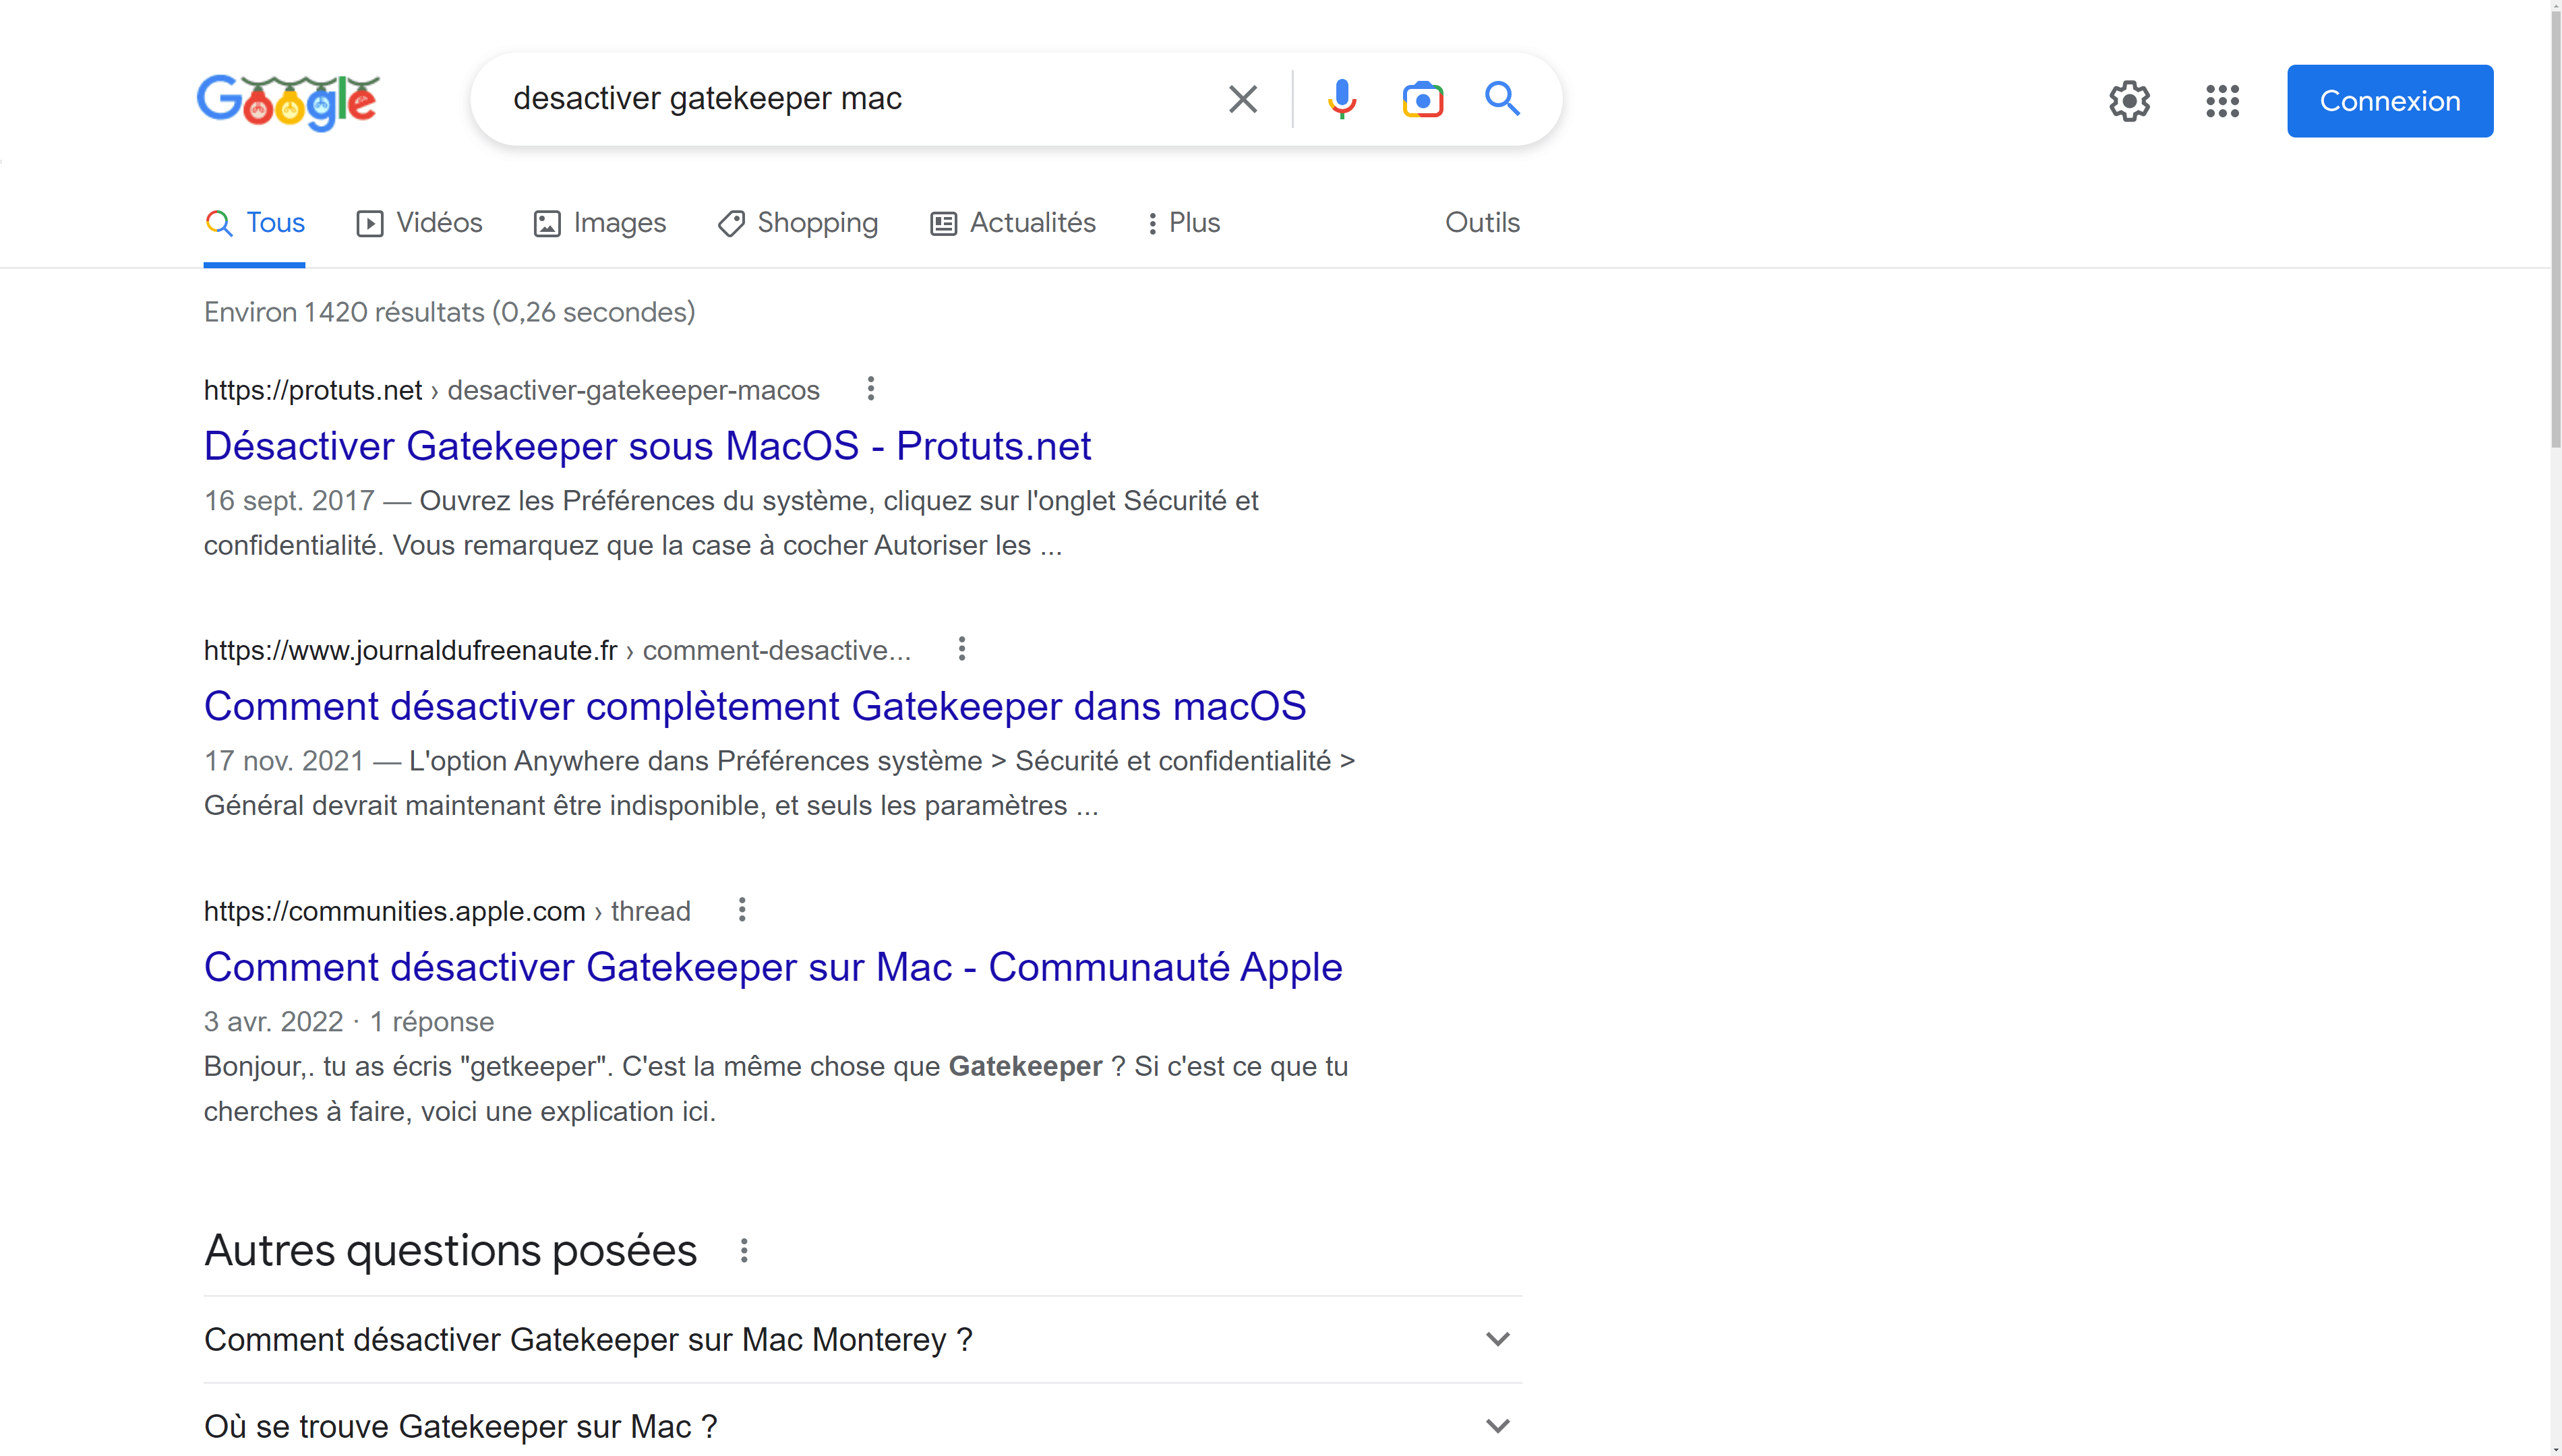
It is interesting to note that ranking number 1 in Google for this keyword generates a lot of traffic with a Click-Thru-Rate (CTR) as high as 70.8%. A recent report by Backlinko determined that the average CTR for the number one position in Google is 27.6%, going up to 60.4% for branded keywords where the brand’s website is often first. This probably demonstrates that users searching to fix urgent computer problems are more likely to click links in Google’s results than for many other types of searches.
The list of queries can be sorted by any column in the table. Sorting the table by Impressions can help you identify keywords with a lot of potential because they are frequently searched for.

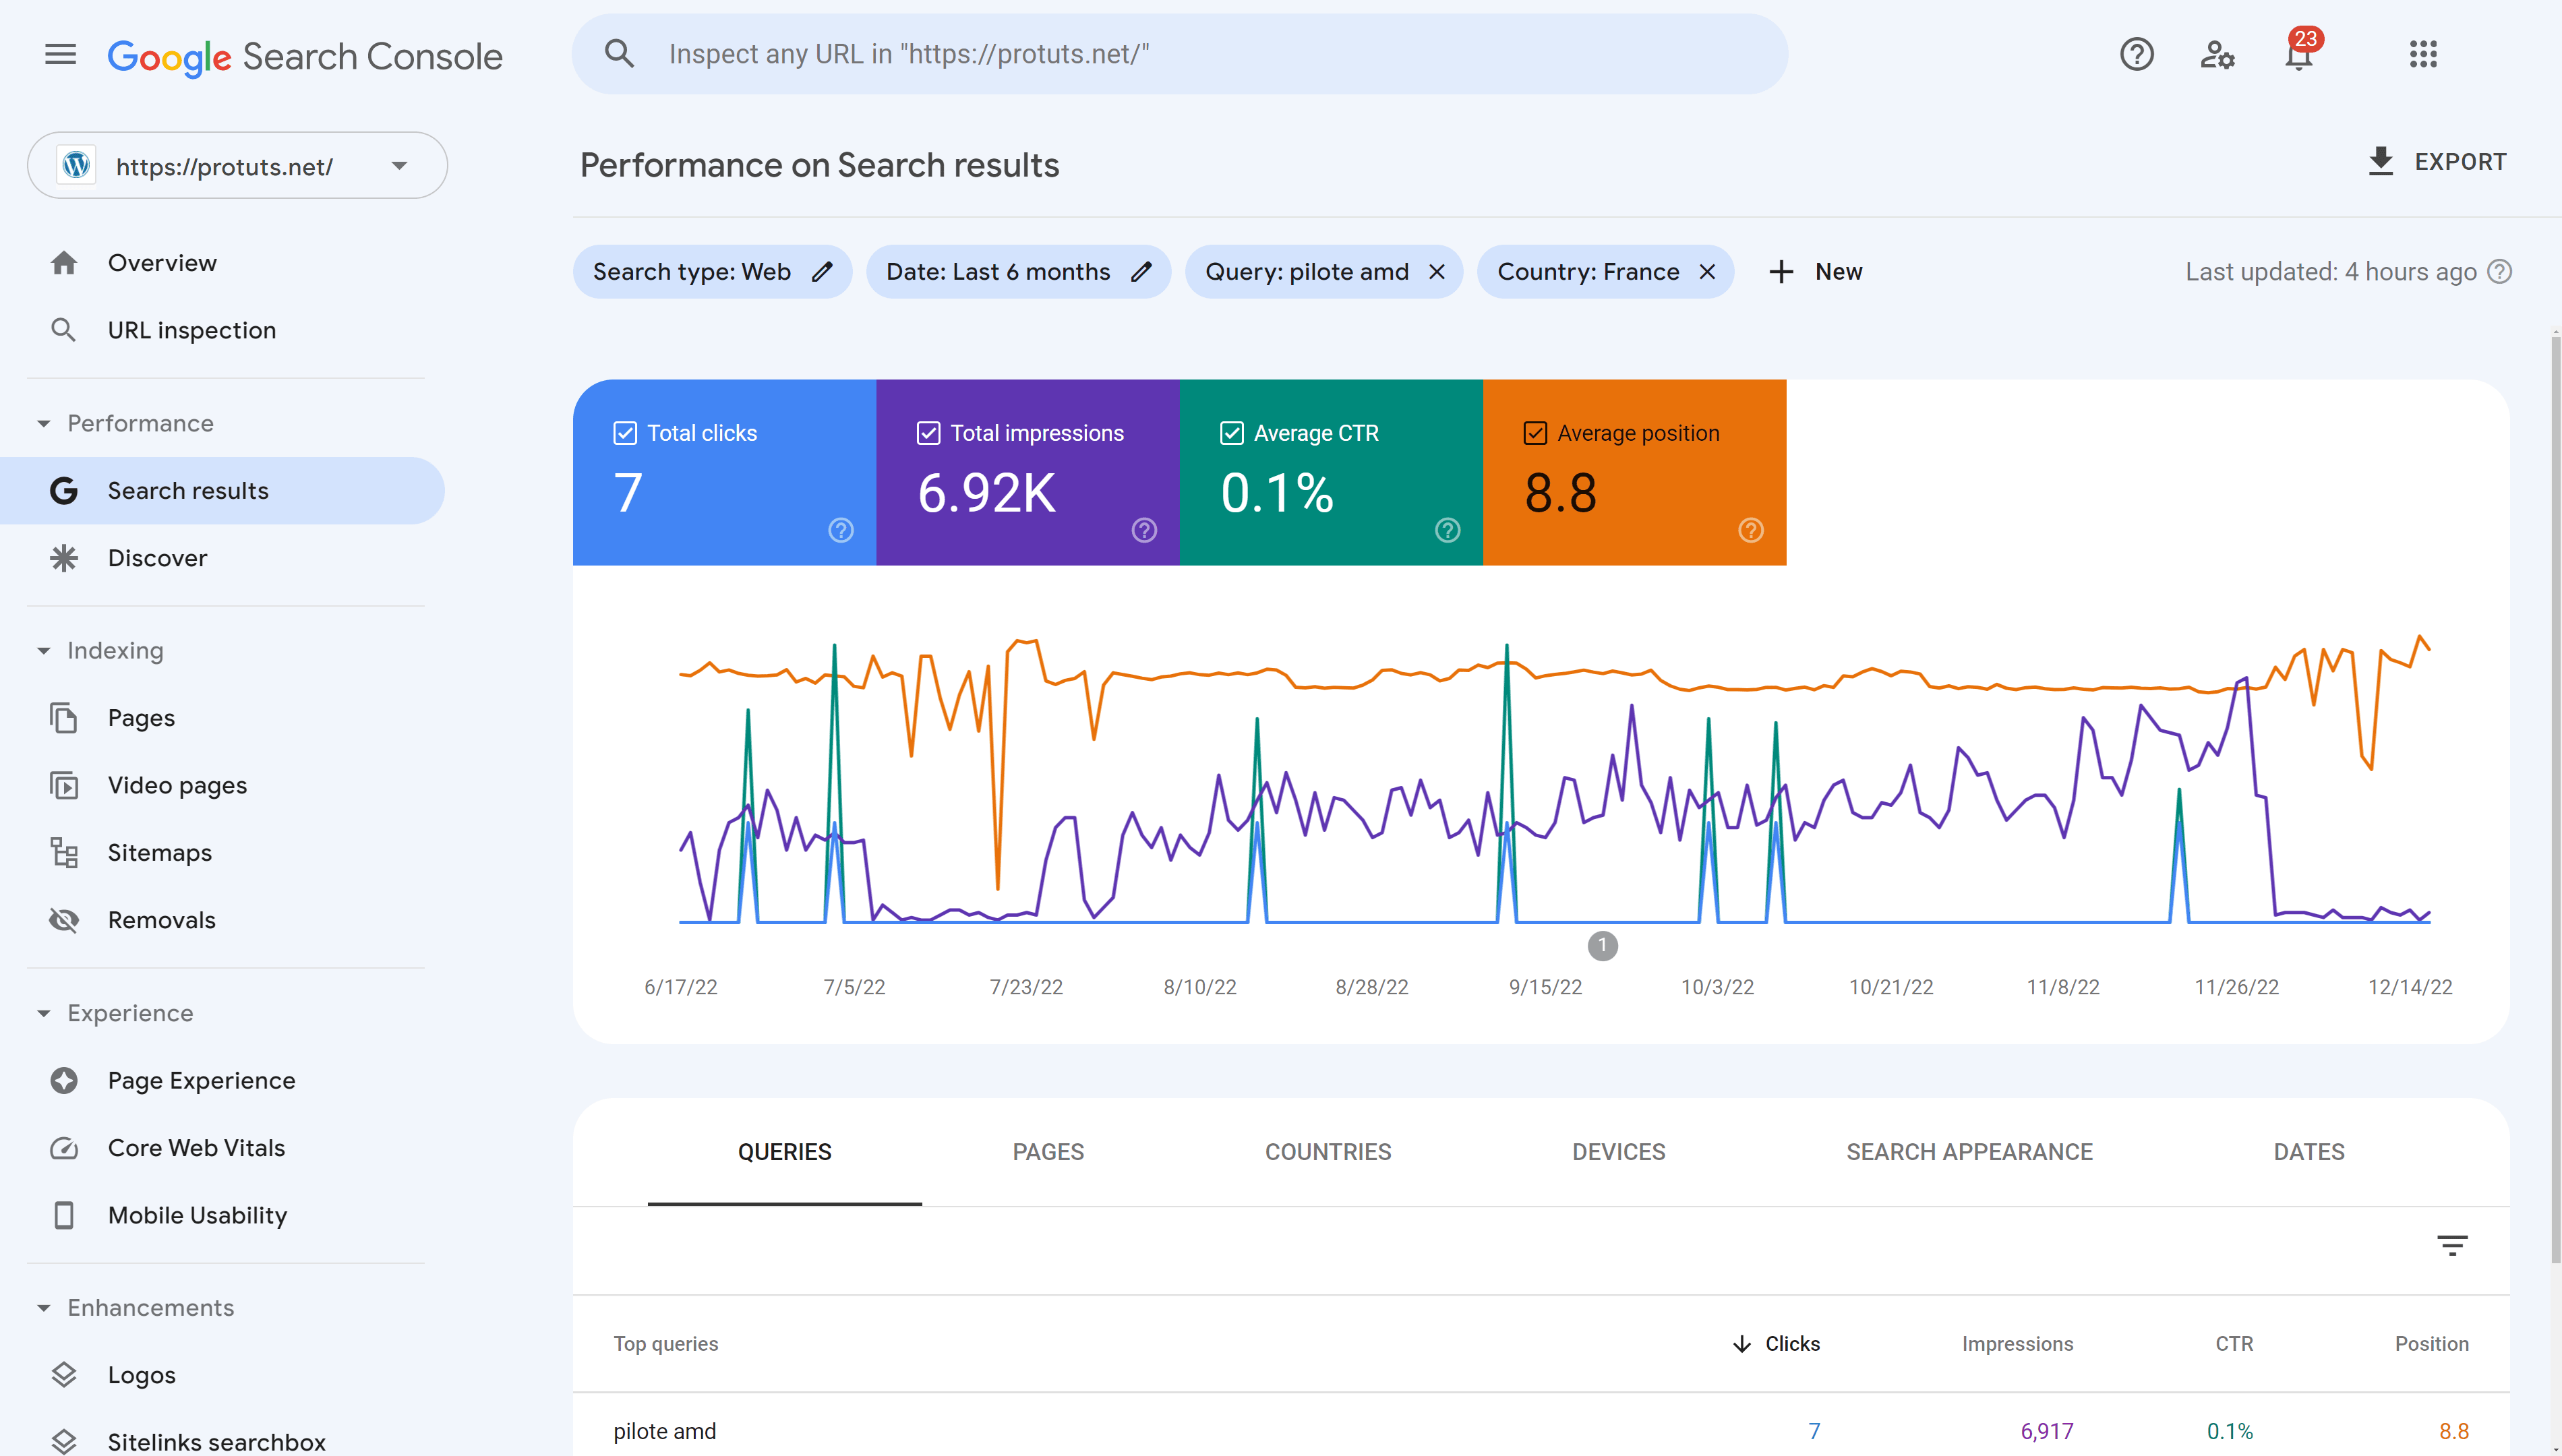
After sorting the list by Impressions we can see that the Protuts.net site was visible 6.917 times in 6 months for the search query “pilote AMD” and 4.657 times for “AMD pilote” (these are searches for the AMD driver). The site is ranked on average 8.1 and 8.8 times and has a very low CTR, generating only 16 clicks in 6 months. A site ranked 1stfor these queries with a CTR of 70% would have obtained over 7000 clicks in 6 months.
By clicking on a keyword in this list we can see the line graph for that keyword alone.
Then, clicking on the PAGES tab between the graph and the table, we can show which URLs were displayed for that query. In this case there is just one page on protuts.net that ranks for this query.
Search results report showing URLs for one keyword
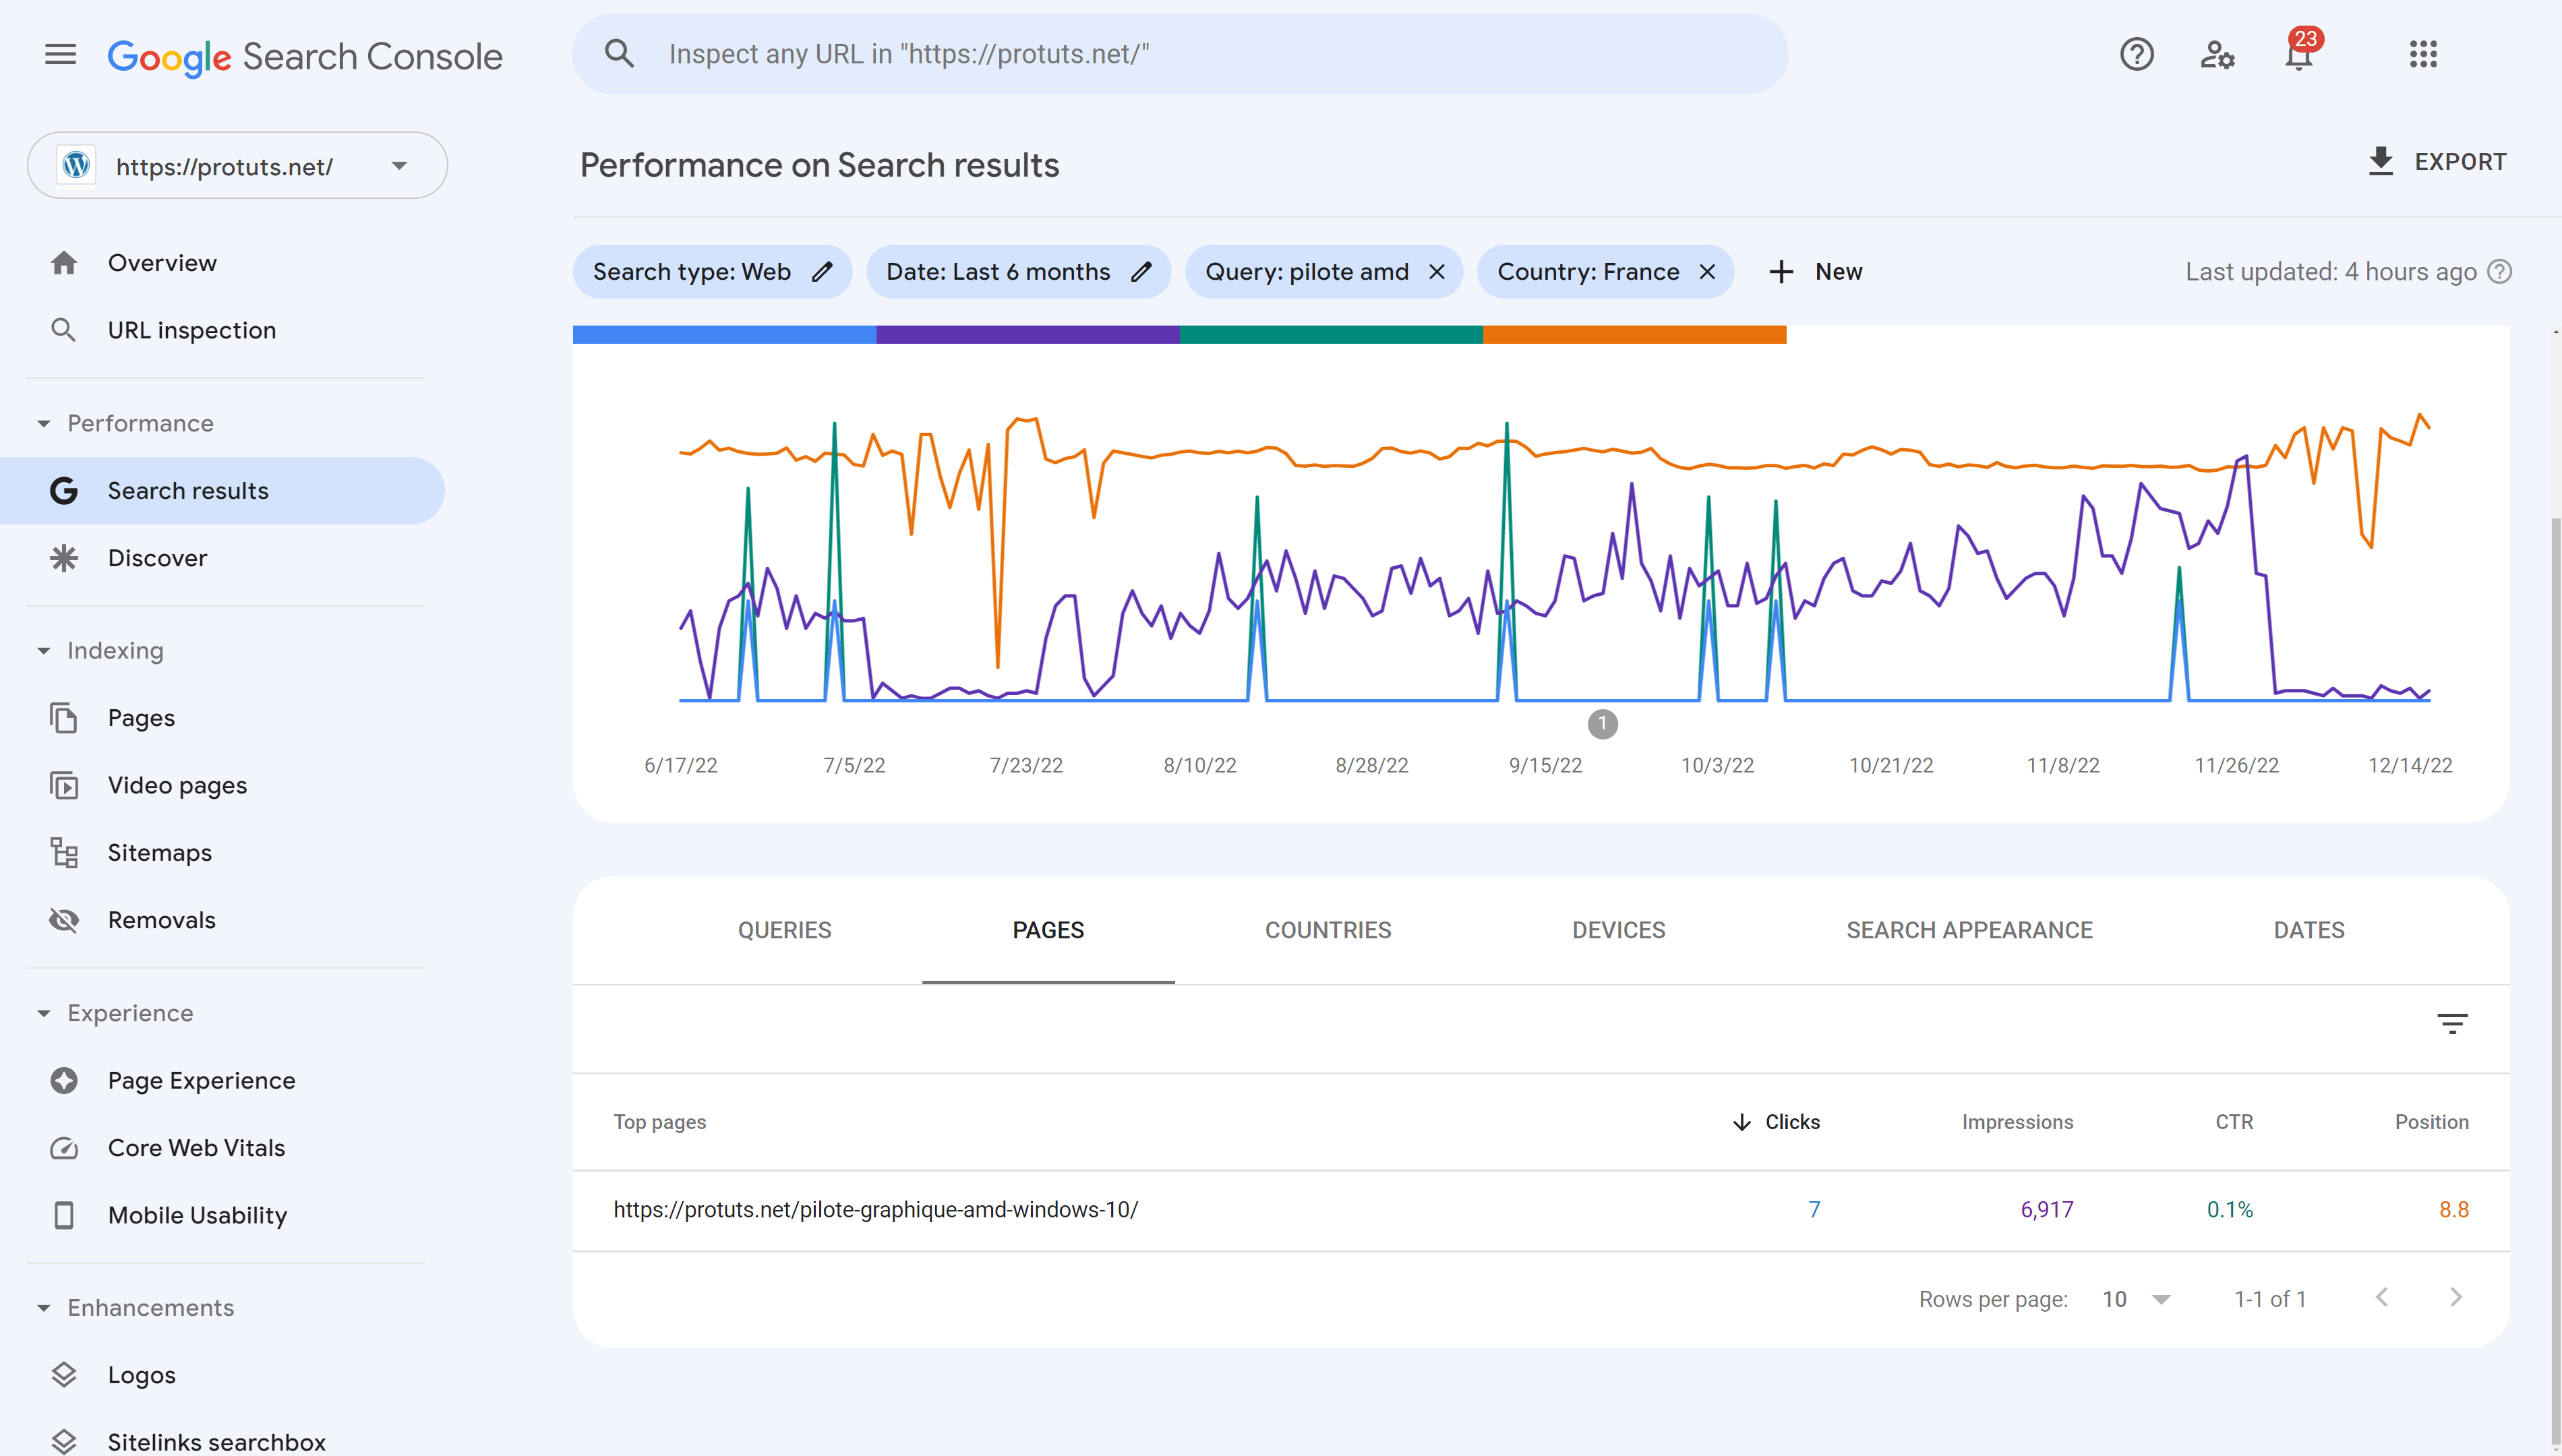
It may be possible to optimize this existing page for the search query “pilote AMD” or create a better page for the keyword. In some cases, creating a cluster of pages around one keyword can be the best method to rank for a difficult keyword. It is worth noting, by following the orange line in the graph above, that this site is not consistently ranking at the same position in France.
We suggest that you spend time on your site going through the queries sorted by impressions to try and spot keywords with a potential in terms of volume of searches (with lots of impressions) and that are also pertinent for your services or products. Refer back to our article Finding SEO keywords for your WordPress site to see how this can fit into your general keyword research strategy.
To help analyze the results you may want to export them to Excel or Google Sheets. You can do this by clicking on the EXPORT button at the top right side of the report.
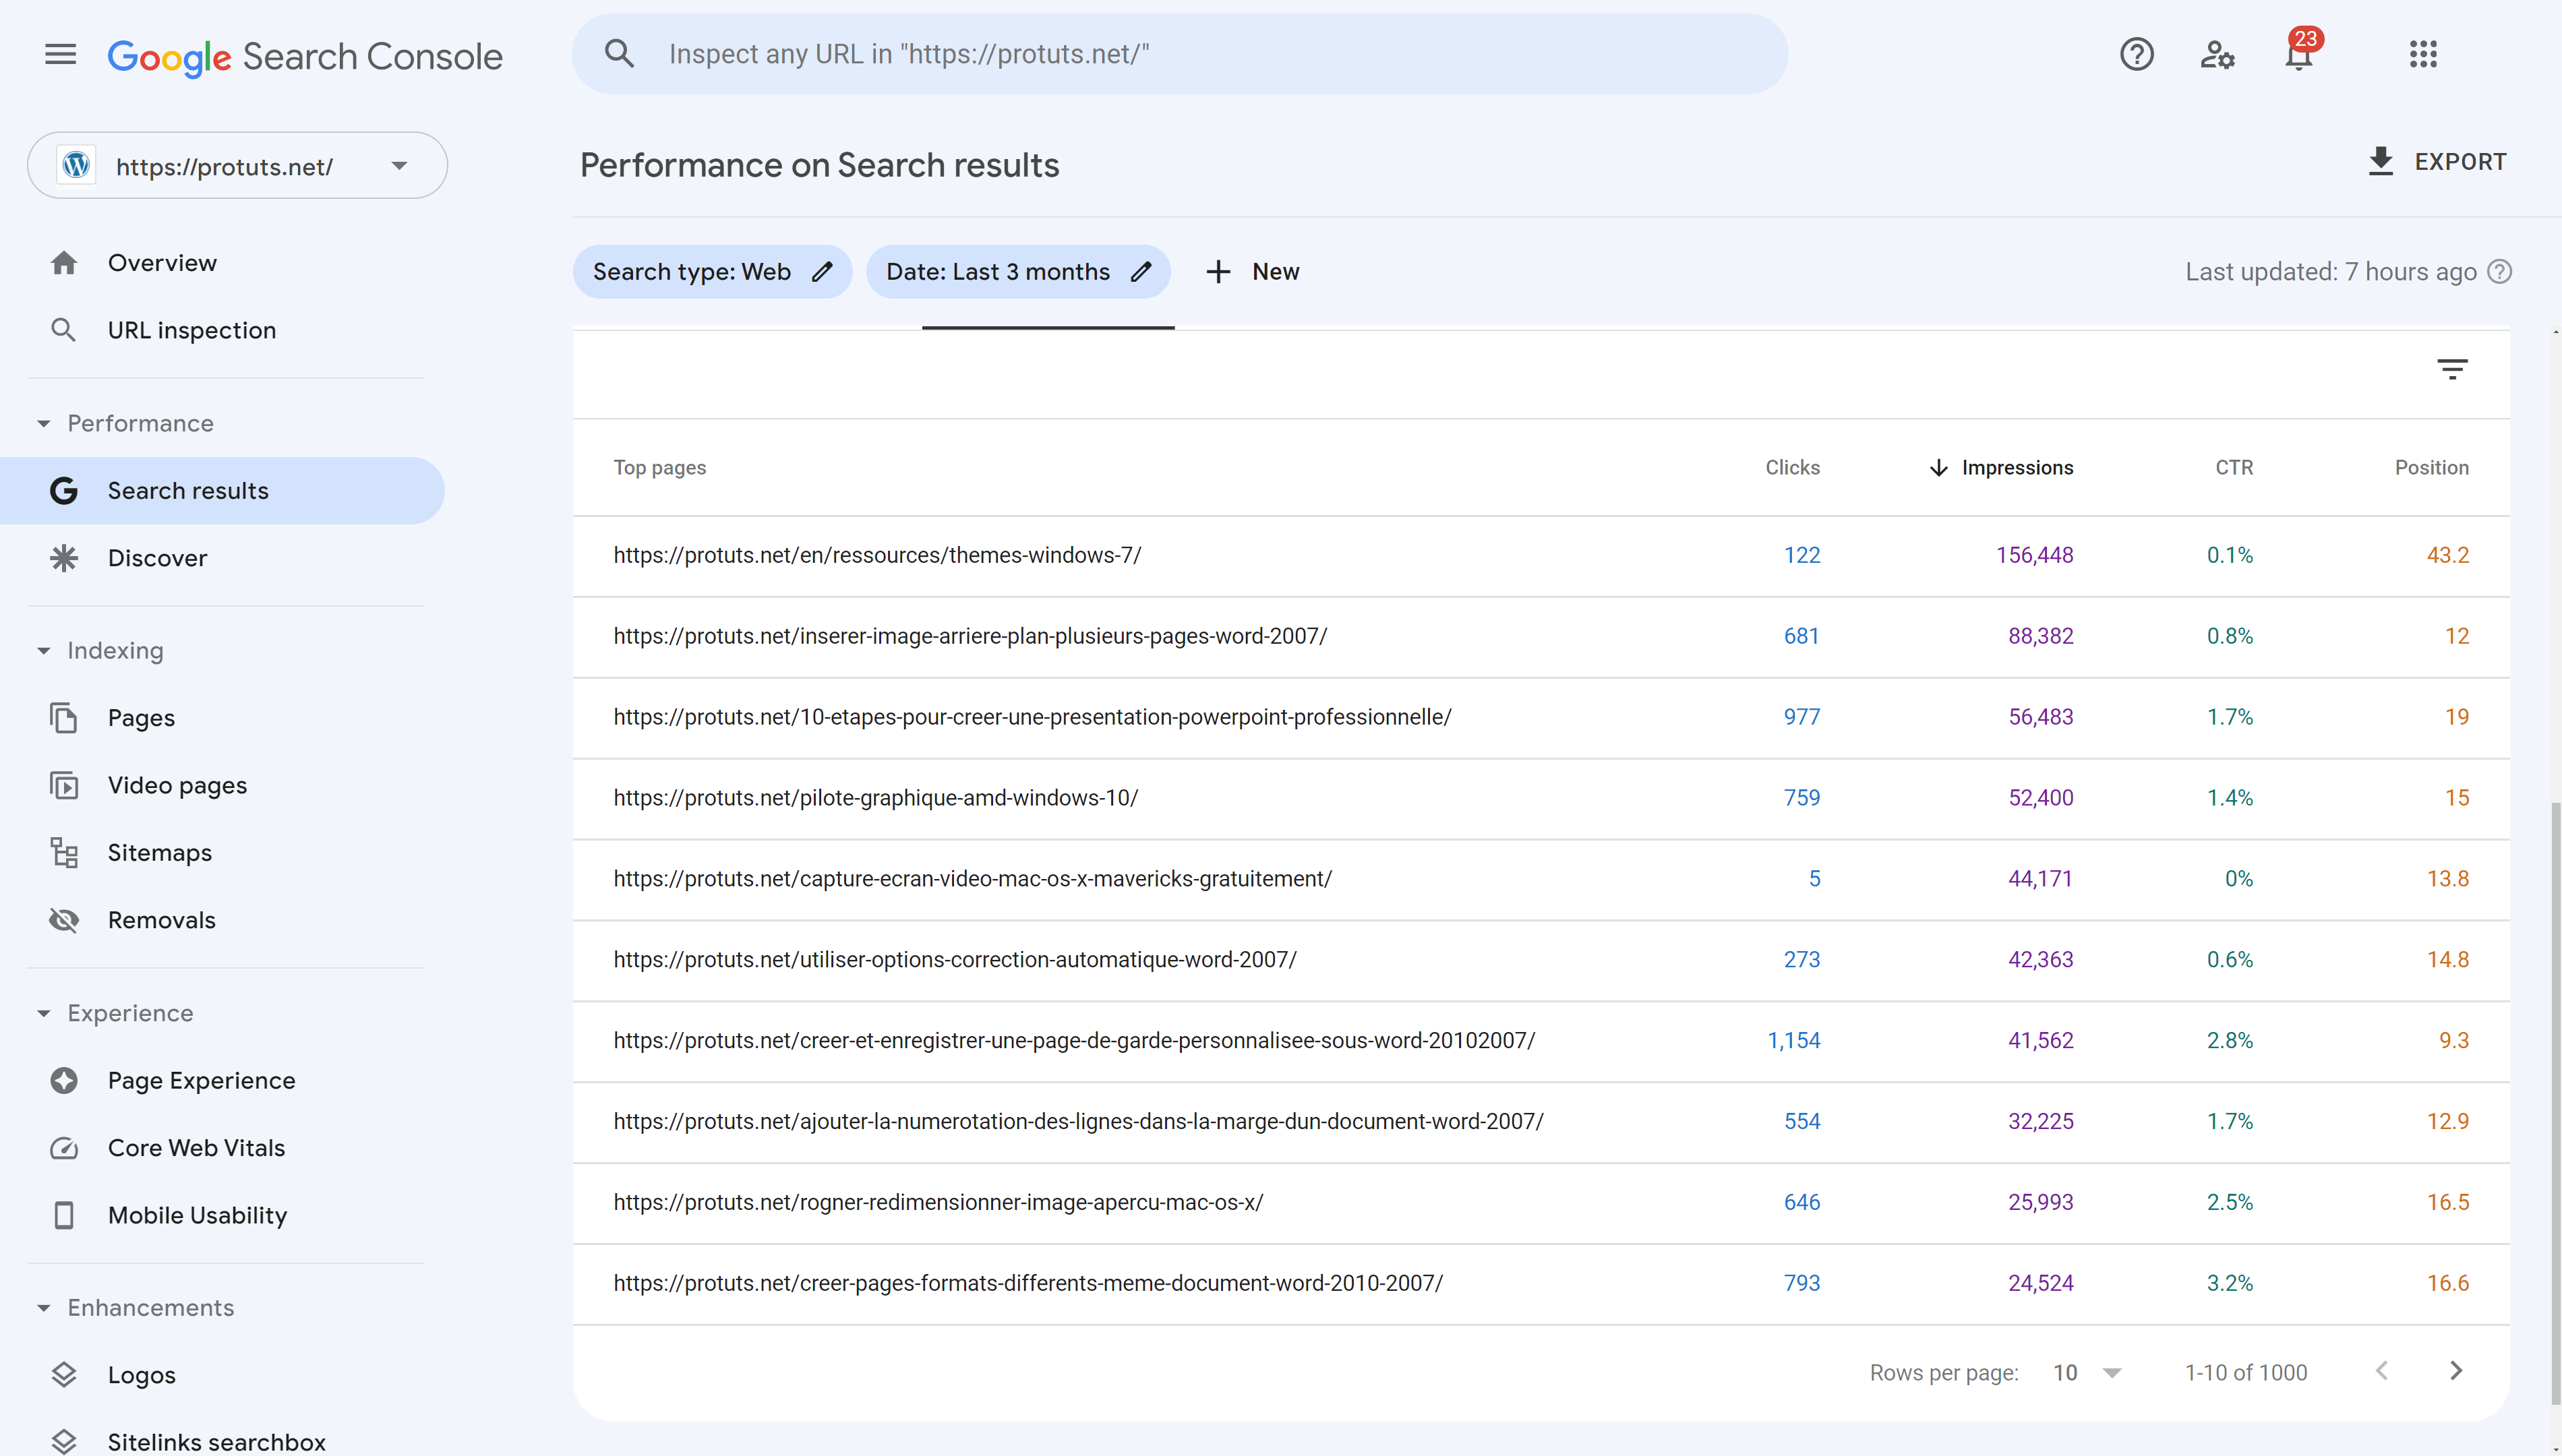
Showing the pages that perform the best for SEO
Going back to full search results by removing the filter on the query and country, you can use the PAGES tab to show the top pages from your website. Sorted by clicks the table shows the pages that obtain the most visits from Google. Sorted by Impressions you can see the pages that have the most visibility in Google.
Using SEOPress PRO you can import this data into WordPress to show it when listing posts, pages or other post types. You can also click on the column headers in WordPress to sort by KPI.
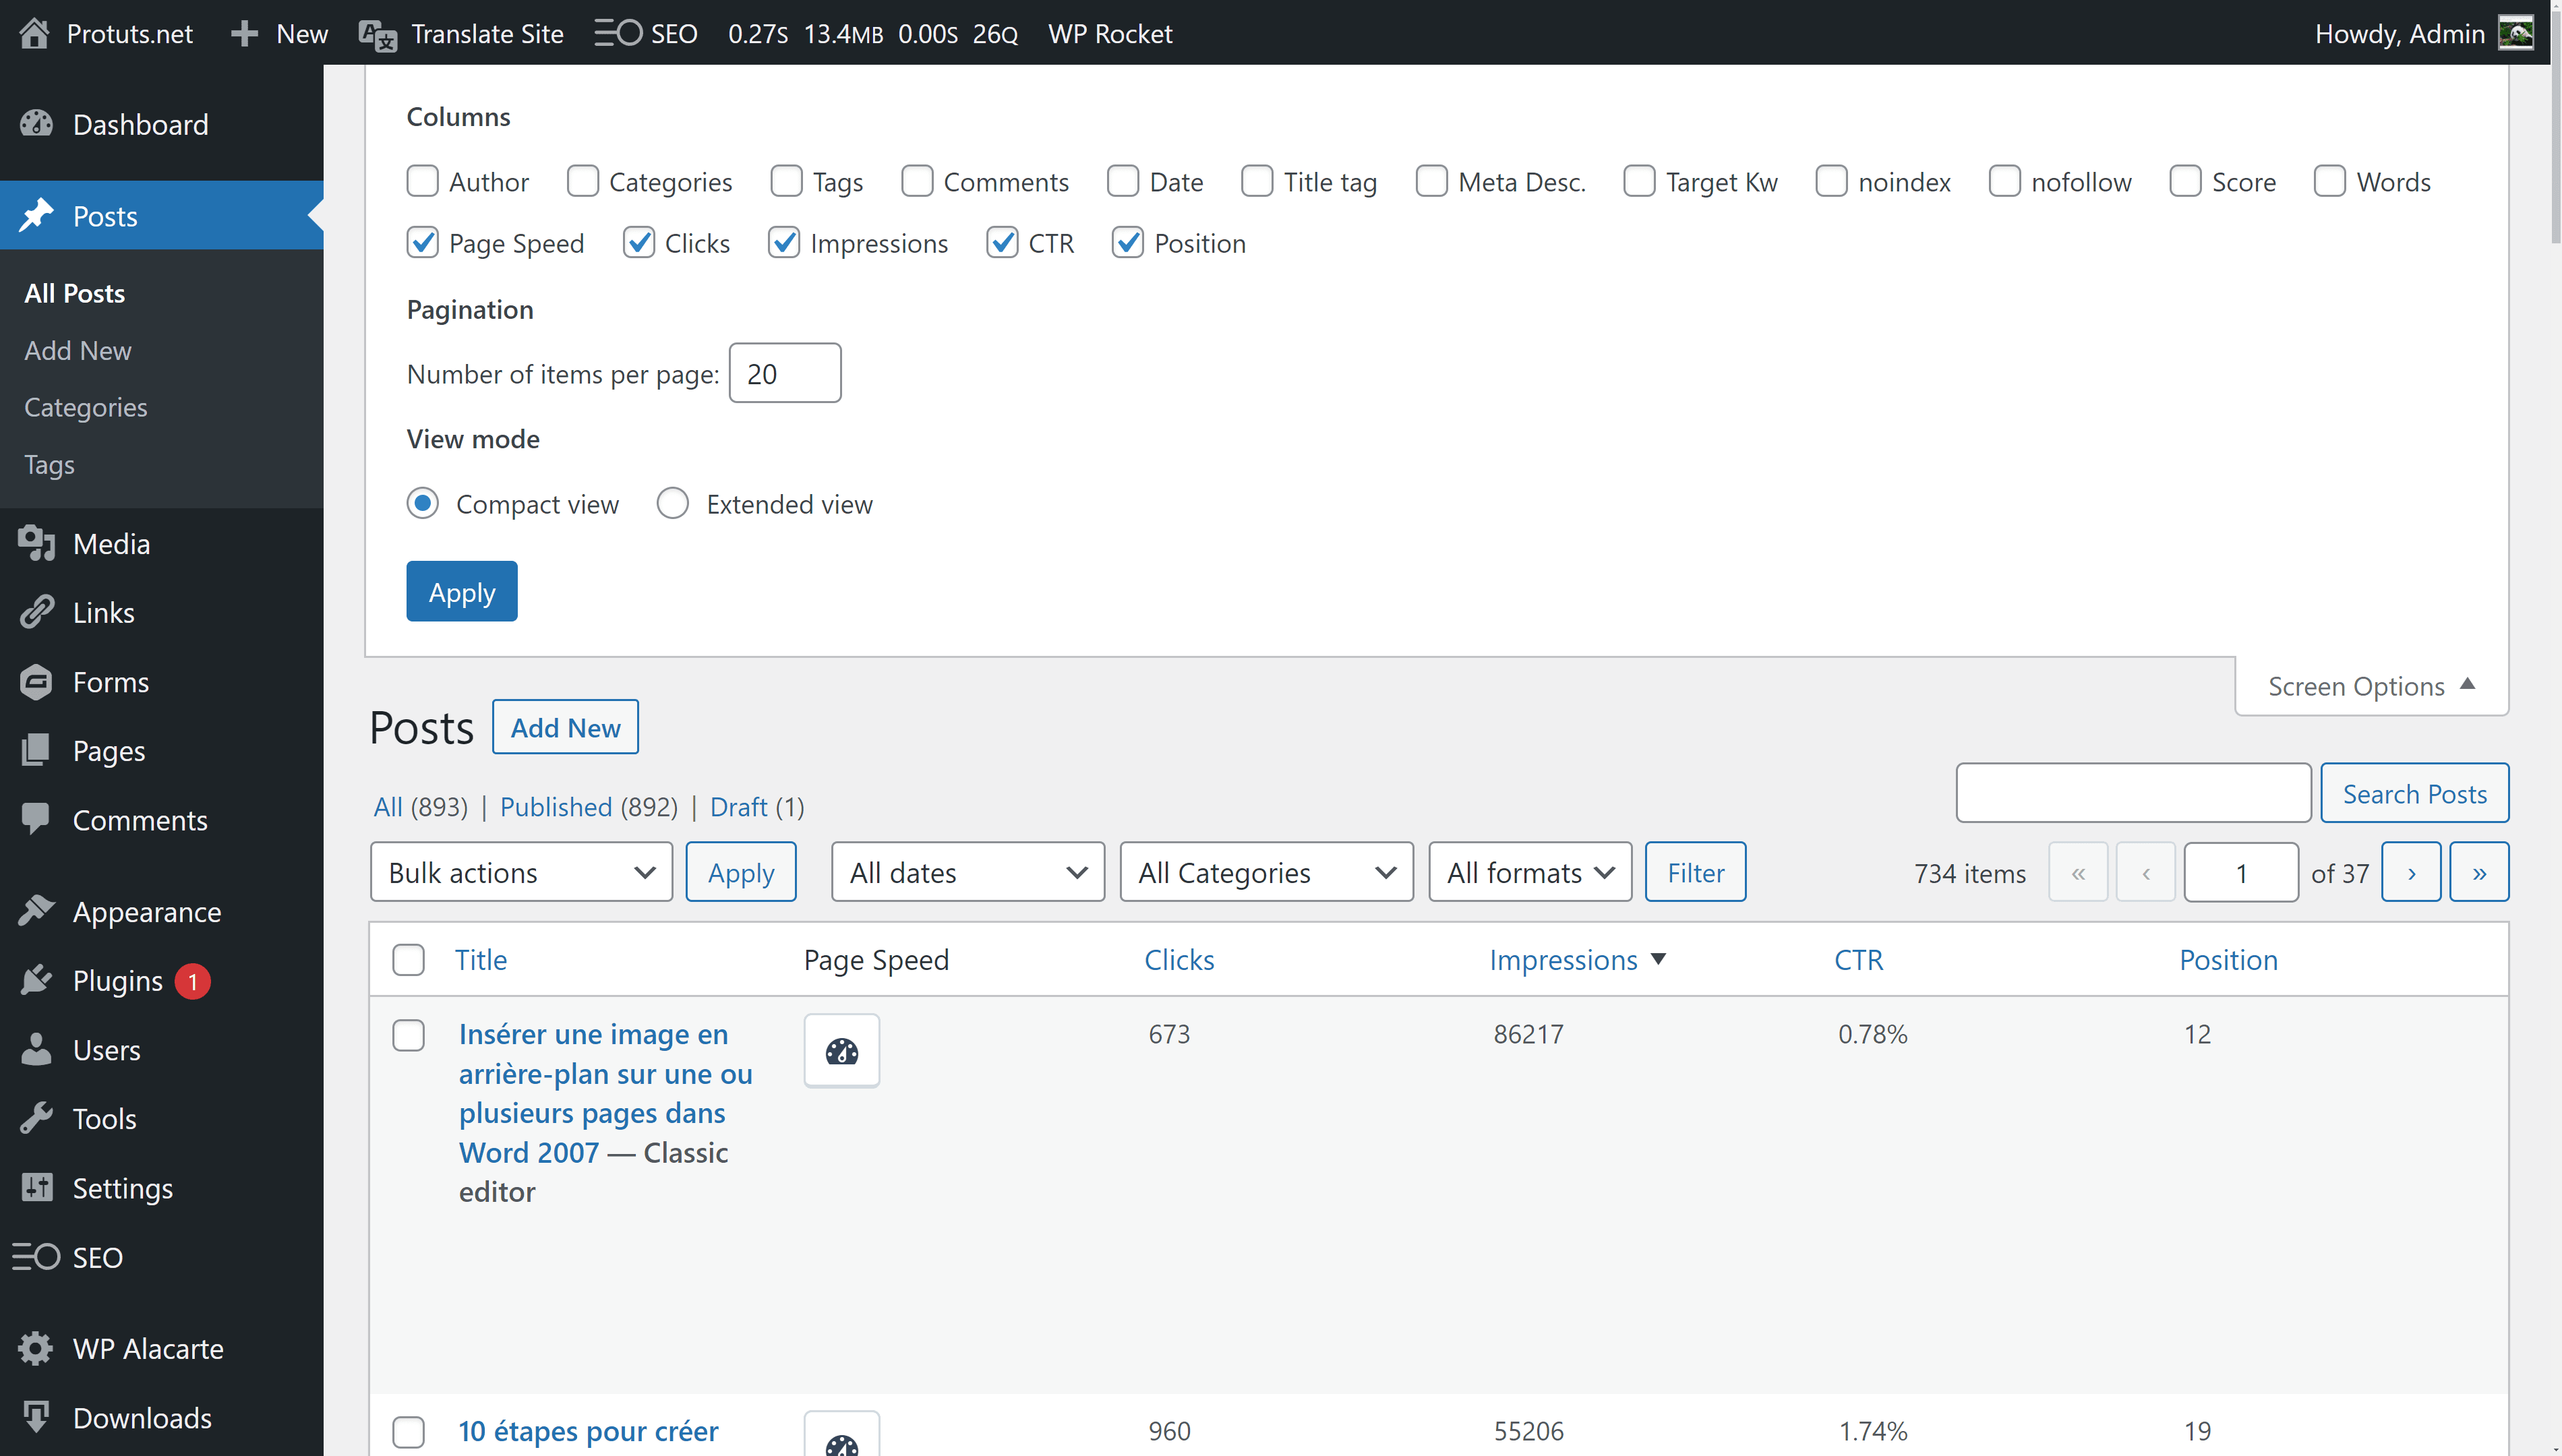
See SEOPress version 6.2 release notes for more information on this feature.


