There are many reasons why you would want to audit the speed of your WordPress site but let us assume that you are motivated by improving your ranking in Google. As discussed in our article Page Speed, Google, Ranking and WordPress, page speed has been a ranking factor in Google since 2010. In 2021, however, page speed was integrated into the new Page experience signals via Core Web Vitals.
Since June 2021, a page that passes the Core Web Vitals assessment can obtain a boost in ranking for mobile searches. From March 2022, it will apply to desktop searches too. However, it is important to remember that passing Core Web Vitals is not sufficient to earn the Page experience boost, you must also be sure to use the HTTPS protocol (the URLs of your site must start with https:// and not http://) and avoid using intrusive popups on your page. For mobile ranking the page must also pass the Mobile-Friendly Test from Google.
Lastest version of PageSpeed Insights
Reflecting its long-term commitment to helping webmasters increase the speed of their sites, Google launched PageSpeed tools in 2010. These tools were made available as a web service called PageSpeed Insights. This is the tool that we suggest you use to audit the speed of your WordPress site.
PageSpeed Insights was updated in 2020 to integrate Core Web Vitals, but it had a complete overhaul in November 2021 with a new URL (https://pagespeed.web.dev/) and a new design that significantly highlighted Core Web Vitals assessment results.
Preparing the audit
The main mistake when auditing the speed of your website is to concentrate on the home page. Typically, on a successful site, less than half the visitors start on the home page and often it is not the page that would benefit the most from a ranking boost.
You should therefore plan to audit different pages from your website to get an overall picture of your site’s speed. We suggest that you audit the home page and at least one page per post-type. So, for a blog you would audit a page, a post and category page. For an ecommerce site, it would be interesting to audit a product page and a product category page.
Chose pages that have a typical amount of content in terms of words and images. For category pages, select pages that are full rather than pages with just one product or post. Because Core Web Vitals uses data from real visits to your website, it is also a good idea to analyze the pages on your website that had the most visits over the past month. You can use Google Analytics to get this information (go to Behavior > Site Content > All Pages to list pages by pageviews).
If you do not have many visits, you will not obtain Core Web Vitals results.
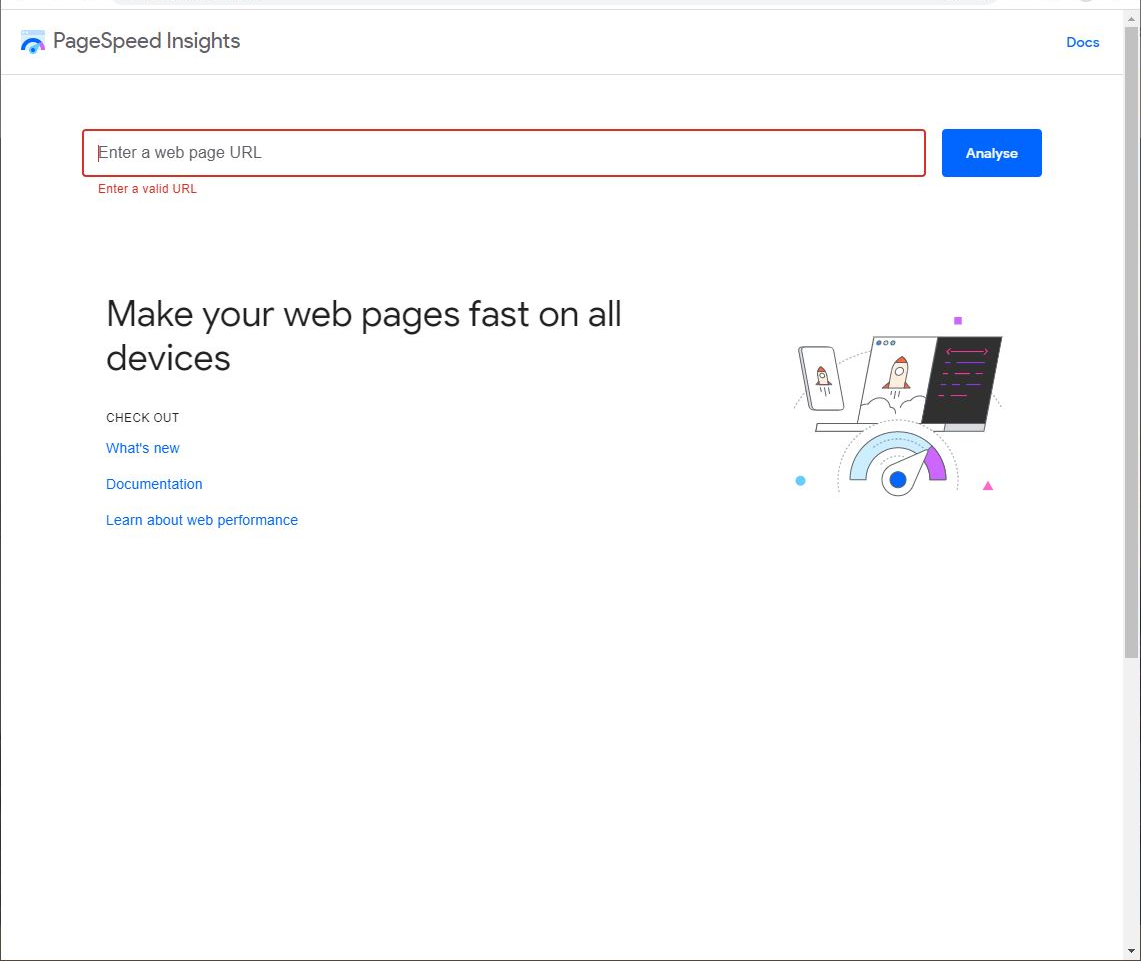
Armed with your list of URLs, go to https://pagespeed.web.dev/.
Part 1 – Core Web Vitals assessment results
From the home page of PageSpeed Insights, enter your first URL and click Analyze. The results will appear after a minute or two.
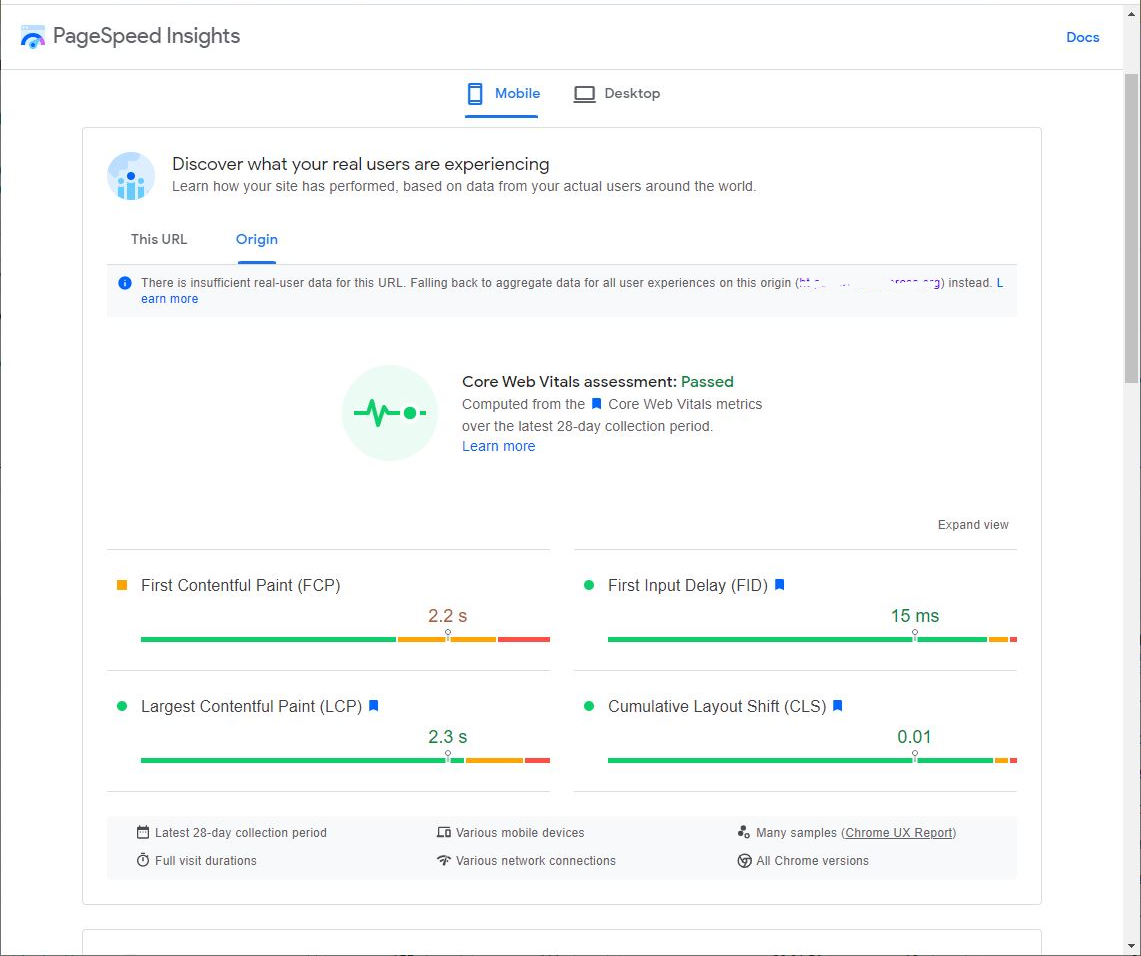
At the top of the page, you will immediately see your Core Web Vital assessment for mobile results.
Core Web Vitals Passed
This screen shot shows a page that has passed the Core Web Vital assessment for mobile – it is clearly marked Passed in green.
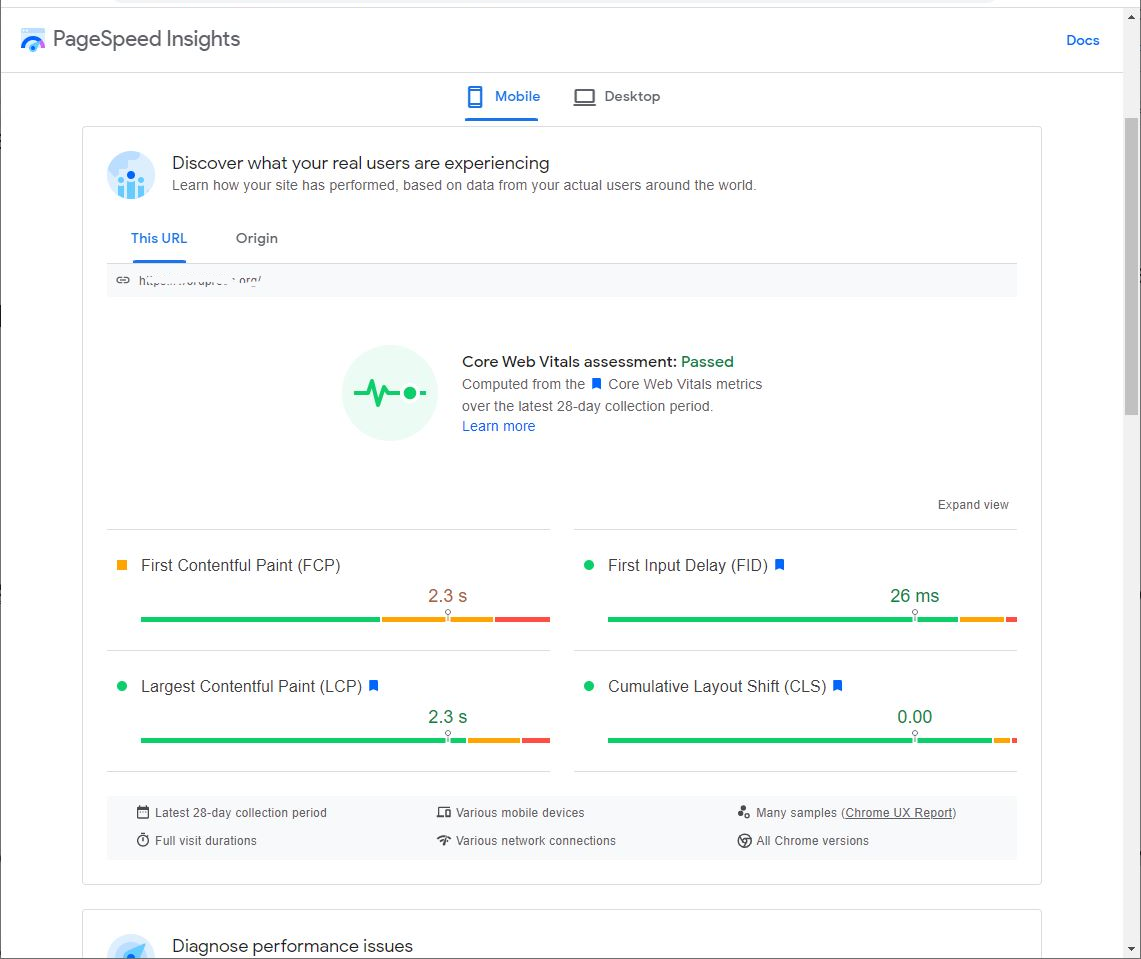
Under this basic result, there are the details of 4 measurements: First Contenful Paint (FCP), First Input Delay (FID), Largest Contentful Paint (LCP) and Cumulative Layout Shift (CLS). Only the last three measurements are used to evaluate Core Web Vitals. These are marked with a blue flag.
First Contenful Paint (FCP), First Input Delay (FID) and Largest Contentful Paint (LCP) measure different aspects of page speed. Cumulative Layout Shift (CLS) measures the stability of the page as it loads. For each measurement, Google sets thresholds for a good and poor page experience.
For example, the score obtained for Largest Contentful Paint (LCP) must be under 2.5 seconds to be considered “Good.” A score over 4 seconds is considered “Bad.” Anything between 2.5 and 4 seconds is described as “Needs improvement.”
For each measurement the green, amber and red bars show the percentage of users who experienced results that were Good (green), Needs Improving (amber) and Bad (red).
In the screenshot above, 80% of visitors had a Good Largest Contentful Paint (LCP) experience, 7% had a Bad experience and 13 % were between Good and Bad thresholds. The average score of 2.3 seconds shown above the bar is the average score of the top 75% results – not the average score of all results.
Core Web Vitals Failed
A page that has failed will look like this. Note the red pictogram and Failed in red. As before, the details for 4 measurements are shown below the result.
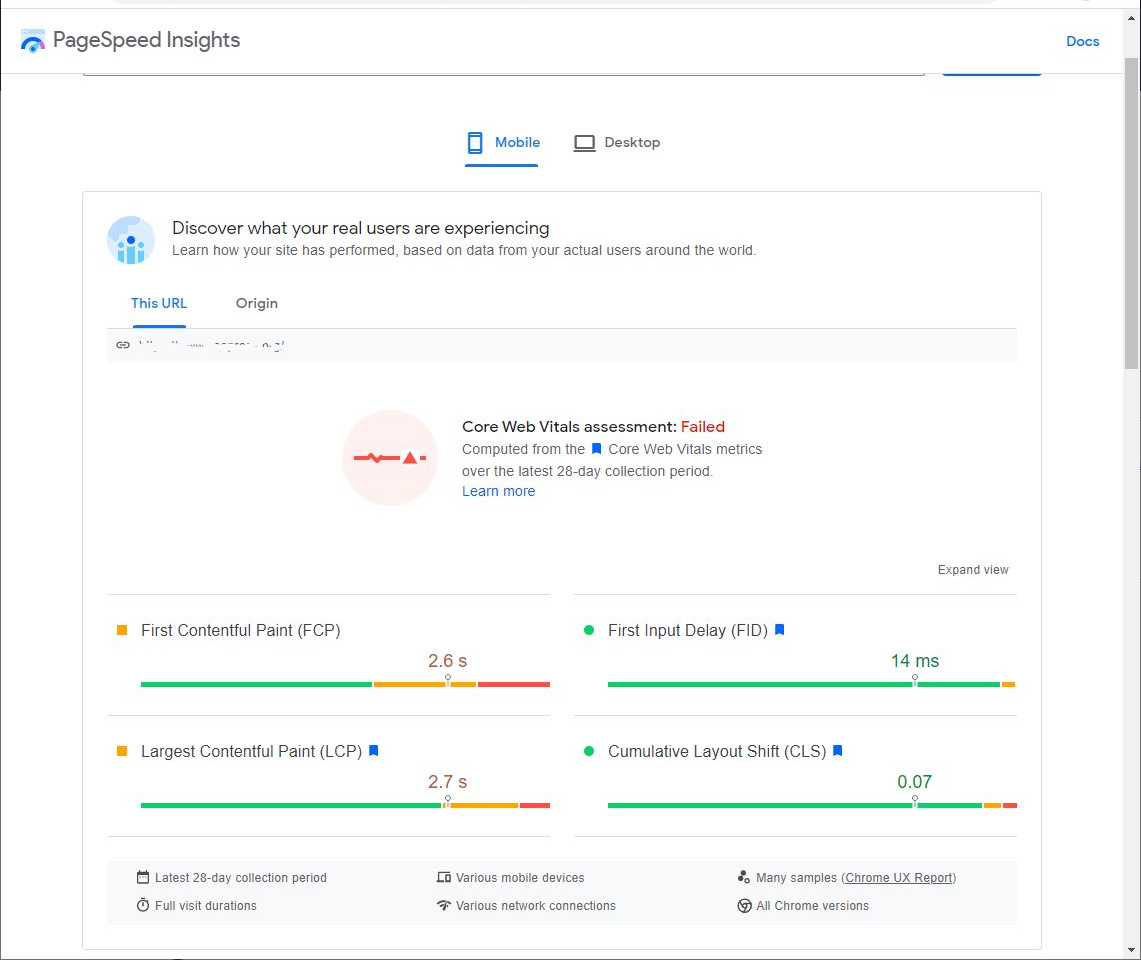
This page passed the assessment for First Input Delay (FID) and Cumulative Layout Shift (CLS), but just failed with the assessment of Largest Contentful Paint (LCP). Only 74% of users experienced a Good experience over the last 28 days. The average time recorded for the 75 % fastest results was 2.7 seconds.
Improving the speed of the page may help pass the Largest Contentful Paint (LCP) assessment in the future. But this score may also improve if more visitors on fast internet connections visit your website.
Core Web Vitals – No data found
It is also possible that there were not enough visitors on your site in the last 28 days to enable Google to evaluate your Core Web Vitals. If this is the case, you will see this result.
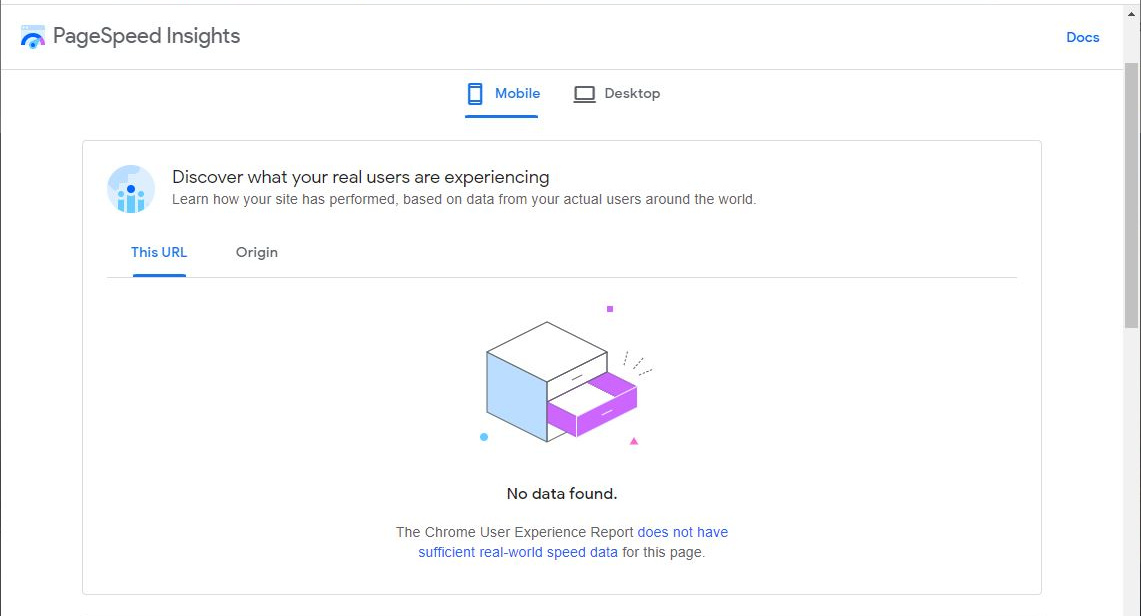
When there is not enough data on your website, you cannot pass the Core Web Vitals assessment and you cannot benefit from a Page experience ranking boost.
Core Web Vitals – Origin
Alternatively, your site may have had enough visitors, but the page that you want to analyze did not. In this case PageSpeed Insights will show average results from the same “origin” meaning all the pages from the same website.
It is believed that the ranking algorithm functions in a similar manner, a page can pass the assessment and receive a ranking boost if the average results for the site pass the assessment – as is the case with this example.
Core Web Vitals – Mobile vs Desktop
Note that with all the screen shots above we are looking at the results for mobile. You must click on the Desktop tab to see the scores and evaluation for Desktop. These results will be different. You may pass Core Web Vitals on one device and not on another. In this example the page has passed both.


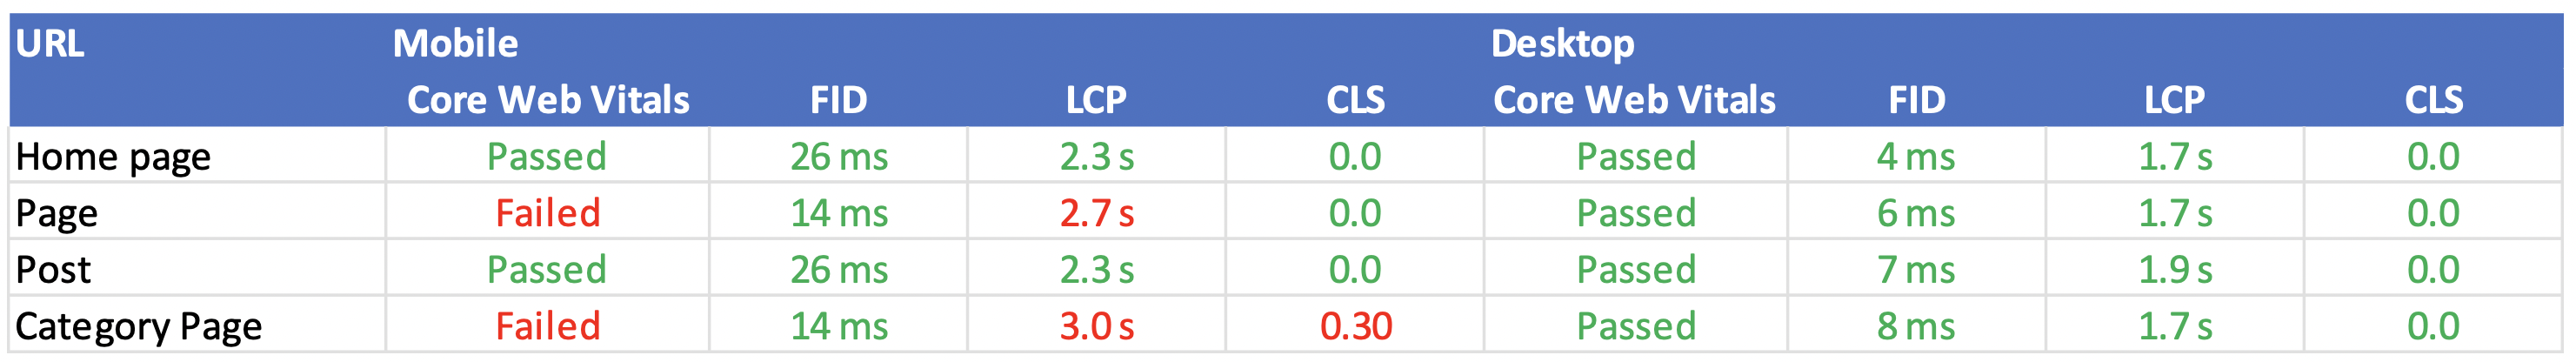
Noting the results of your Audit
To have easy access to these results, you can note them in a spreadsheet. With a line per URL you can add data to columns Mobile Core Web Vitals (Passed, Failed or No Data), Mobile FID, Mobile LCP, Mobile CLS, Desktop Core Web Vitals (Passed, Failed or No Data), Desktop FID, Desktop LCP, Desktop CLS.
Part 2 –Diagnosis performance issues
Under the Core Web Vitals results, you will also see a section entitled “Diagnose performance issues” showing different results for the same page. There is a Mobile and Desktop version of this section too.
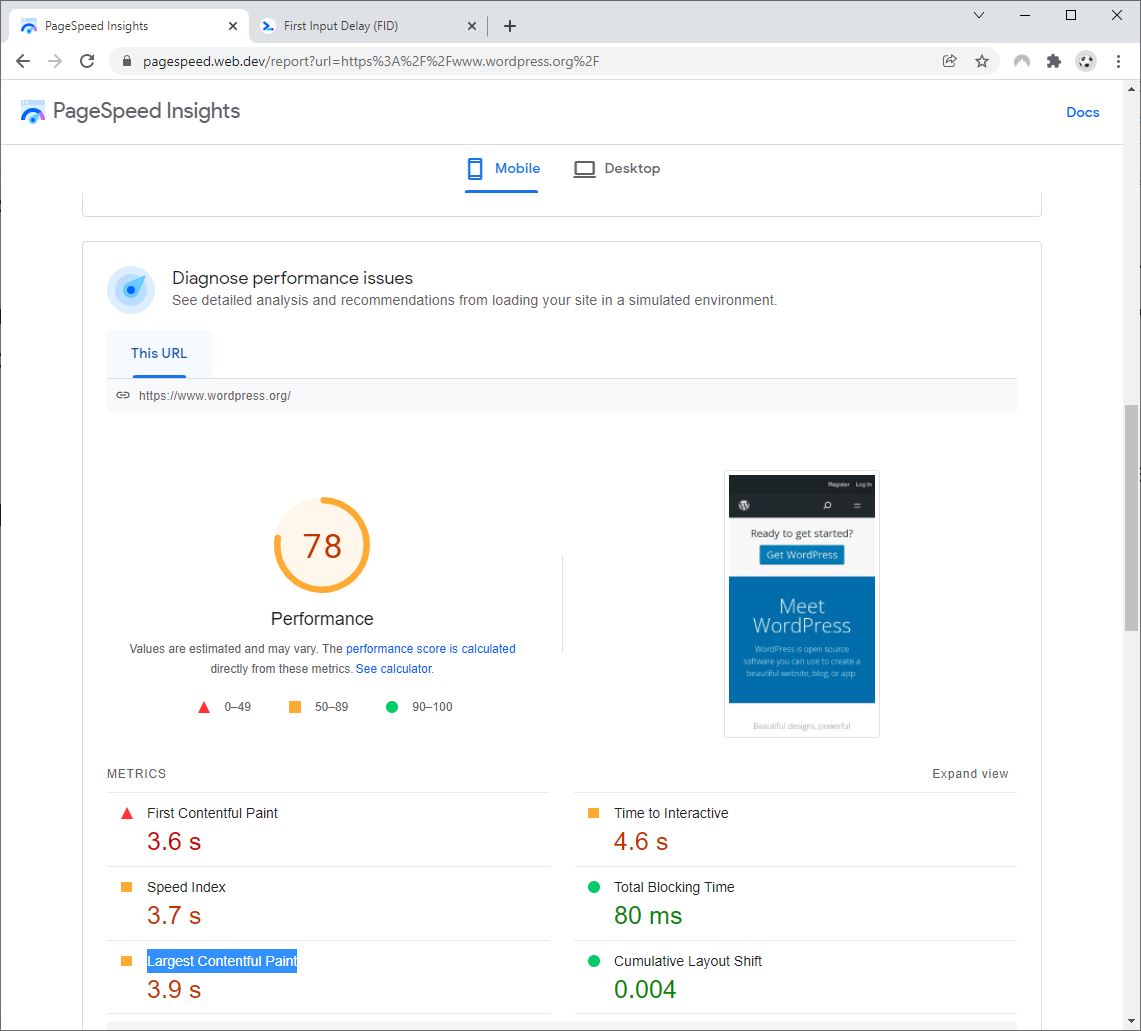
This section shows results of a test that was run as the PageSpeed Insights results page was loading. The test is run using a simulated mobile or desktop environment and – very confusingly – results can be different every time you reload the page and rerun the test.
The results include a Performance score from 0 to 100 and the metrics First Contentful Paint, Time to Interactive, Speed Index, Total Blocking Time, Largest Contentful Paint and Cumulative Layout Shift. Results that are above the Good threshold are written in green with a round pictogram. Results below the Bad threshold are written in red with a triangle pictogram. Results between Good and Bad thresholds (either moderate or needs improving) are written in Orange with a square pictogram.
It is important to note that these scores are not used in ranking your site in Google. They are provided to help quickly test page speed and so enable you to check if changes made to your website will improve the page speed experience.
The Largest Contentful Paint and Cumulative Layout Shift metrics correspond to Core Web Vitals measurements. There is no equivalent of First Input Delay.
If you are failing Core Web Vitals assessments, you can use the scores and the recommendations given in the Opportunities section to improve your website. The recommendations are adapted to WordPress sites when the CMS is detected, recommending types of plugins that can help you improve scores.
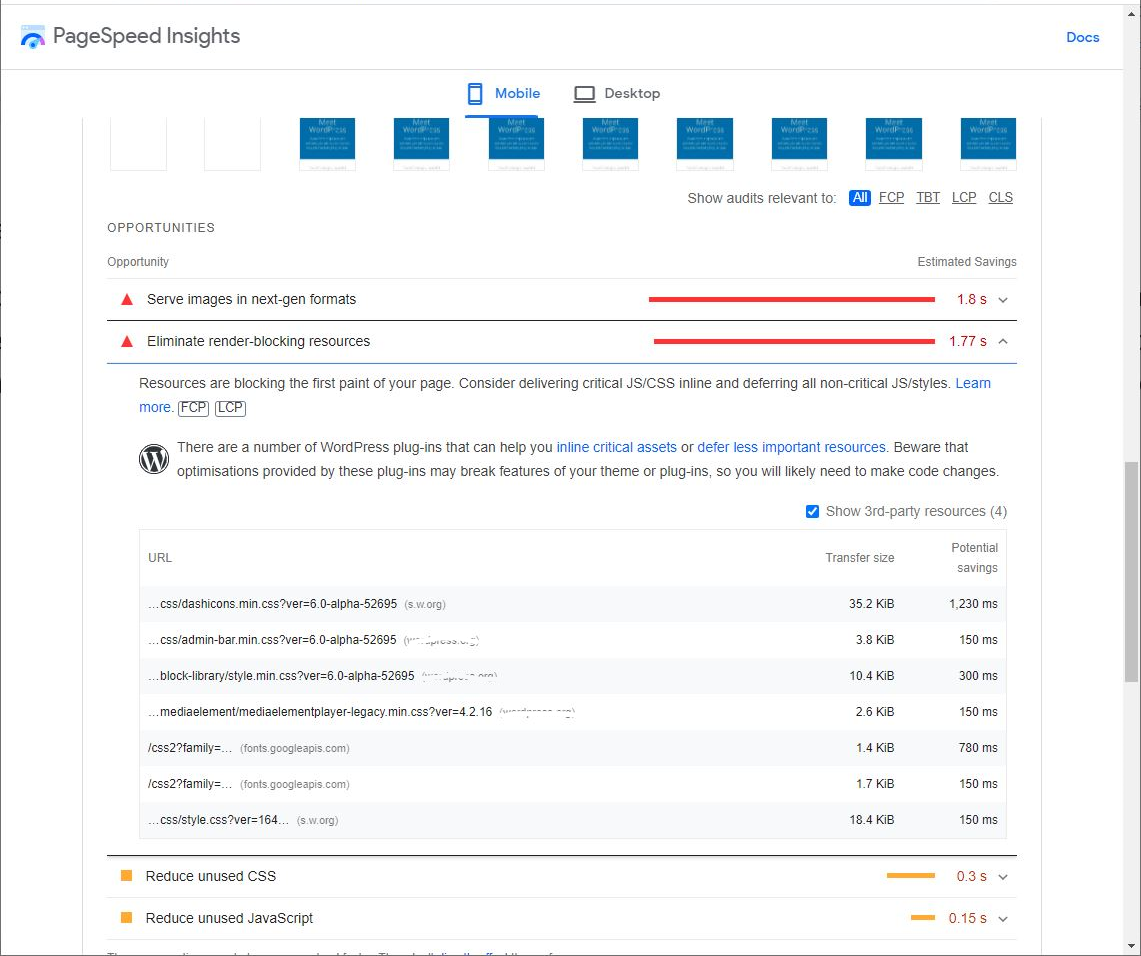
For example, if the analysis detects that resources are blocking the first paint of a page, it may inform you that “There are a number of WordPress plugins that can help you inline critical assets or defer less important resources like WP-Rocket. Beware that optimization provided by these plugins may break features of your theme or plugins, so you will likely need to make code changes.”
Google Ranking factors are linked to the first part of the PageSpeed Insights report. Those concerning Core Web Vitals. However, if you want to improve page speed to improve user experience overall, you can work towards improving the scores in the diagnosis section.