
If you followed the steps in “How to setup and install Google Analytics 4 on WordPress” you will have installed the Google Analytics 4 tag on your WordPress site using SEOPress. The tag will start collecting data on your visitors as soon as it is installed. We recommend collecting data for a few days before coming back and exploring the standard reports of Google Analytics 4.
Take time to follow this guide. Mastering Google Analytics reports will help you to obtain insights into your site’s traffic and help you improve traffic and revenues over time.
What do you want to know?
Before diving into Google Analytics, viewing reports and analyzing data, take a moment to reflect on what you hope to measure through a web analytics tool.
What are the main questions you would like answers to? Some examples could be
- Where do my visitors come from?
- Am I getting more visits from Google this month compared to last month?
- What are the most popular posts on my blog?
- What percentage of visitors order products on my site?
- Is my newsletter generating traffic?
Setting up conversions
For this guide we have used the Google Analytics 4 demo account provided by Google. This Google Analytics property is installed on the Google Merchandise Store and is configured to track purchases. A purchase is a standard event in Google Analytics and is automatically considered as a conversion when it is encountered.
Depending on the objective of your site (online sales, lead generation, traffic) you will get more from Google Analytics if you set up at least one conversion in Google Analytics. See this guide from Google on how to set up conversions on your site.
Google Analytics Home page
When you connect to Google Analytics, the first thing you will see is the Home page for your first property.
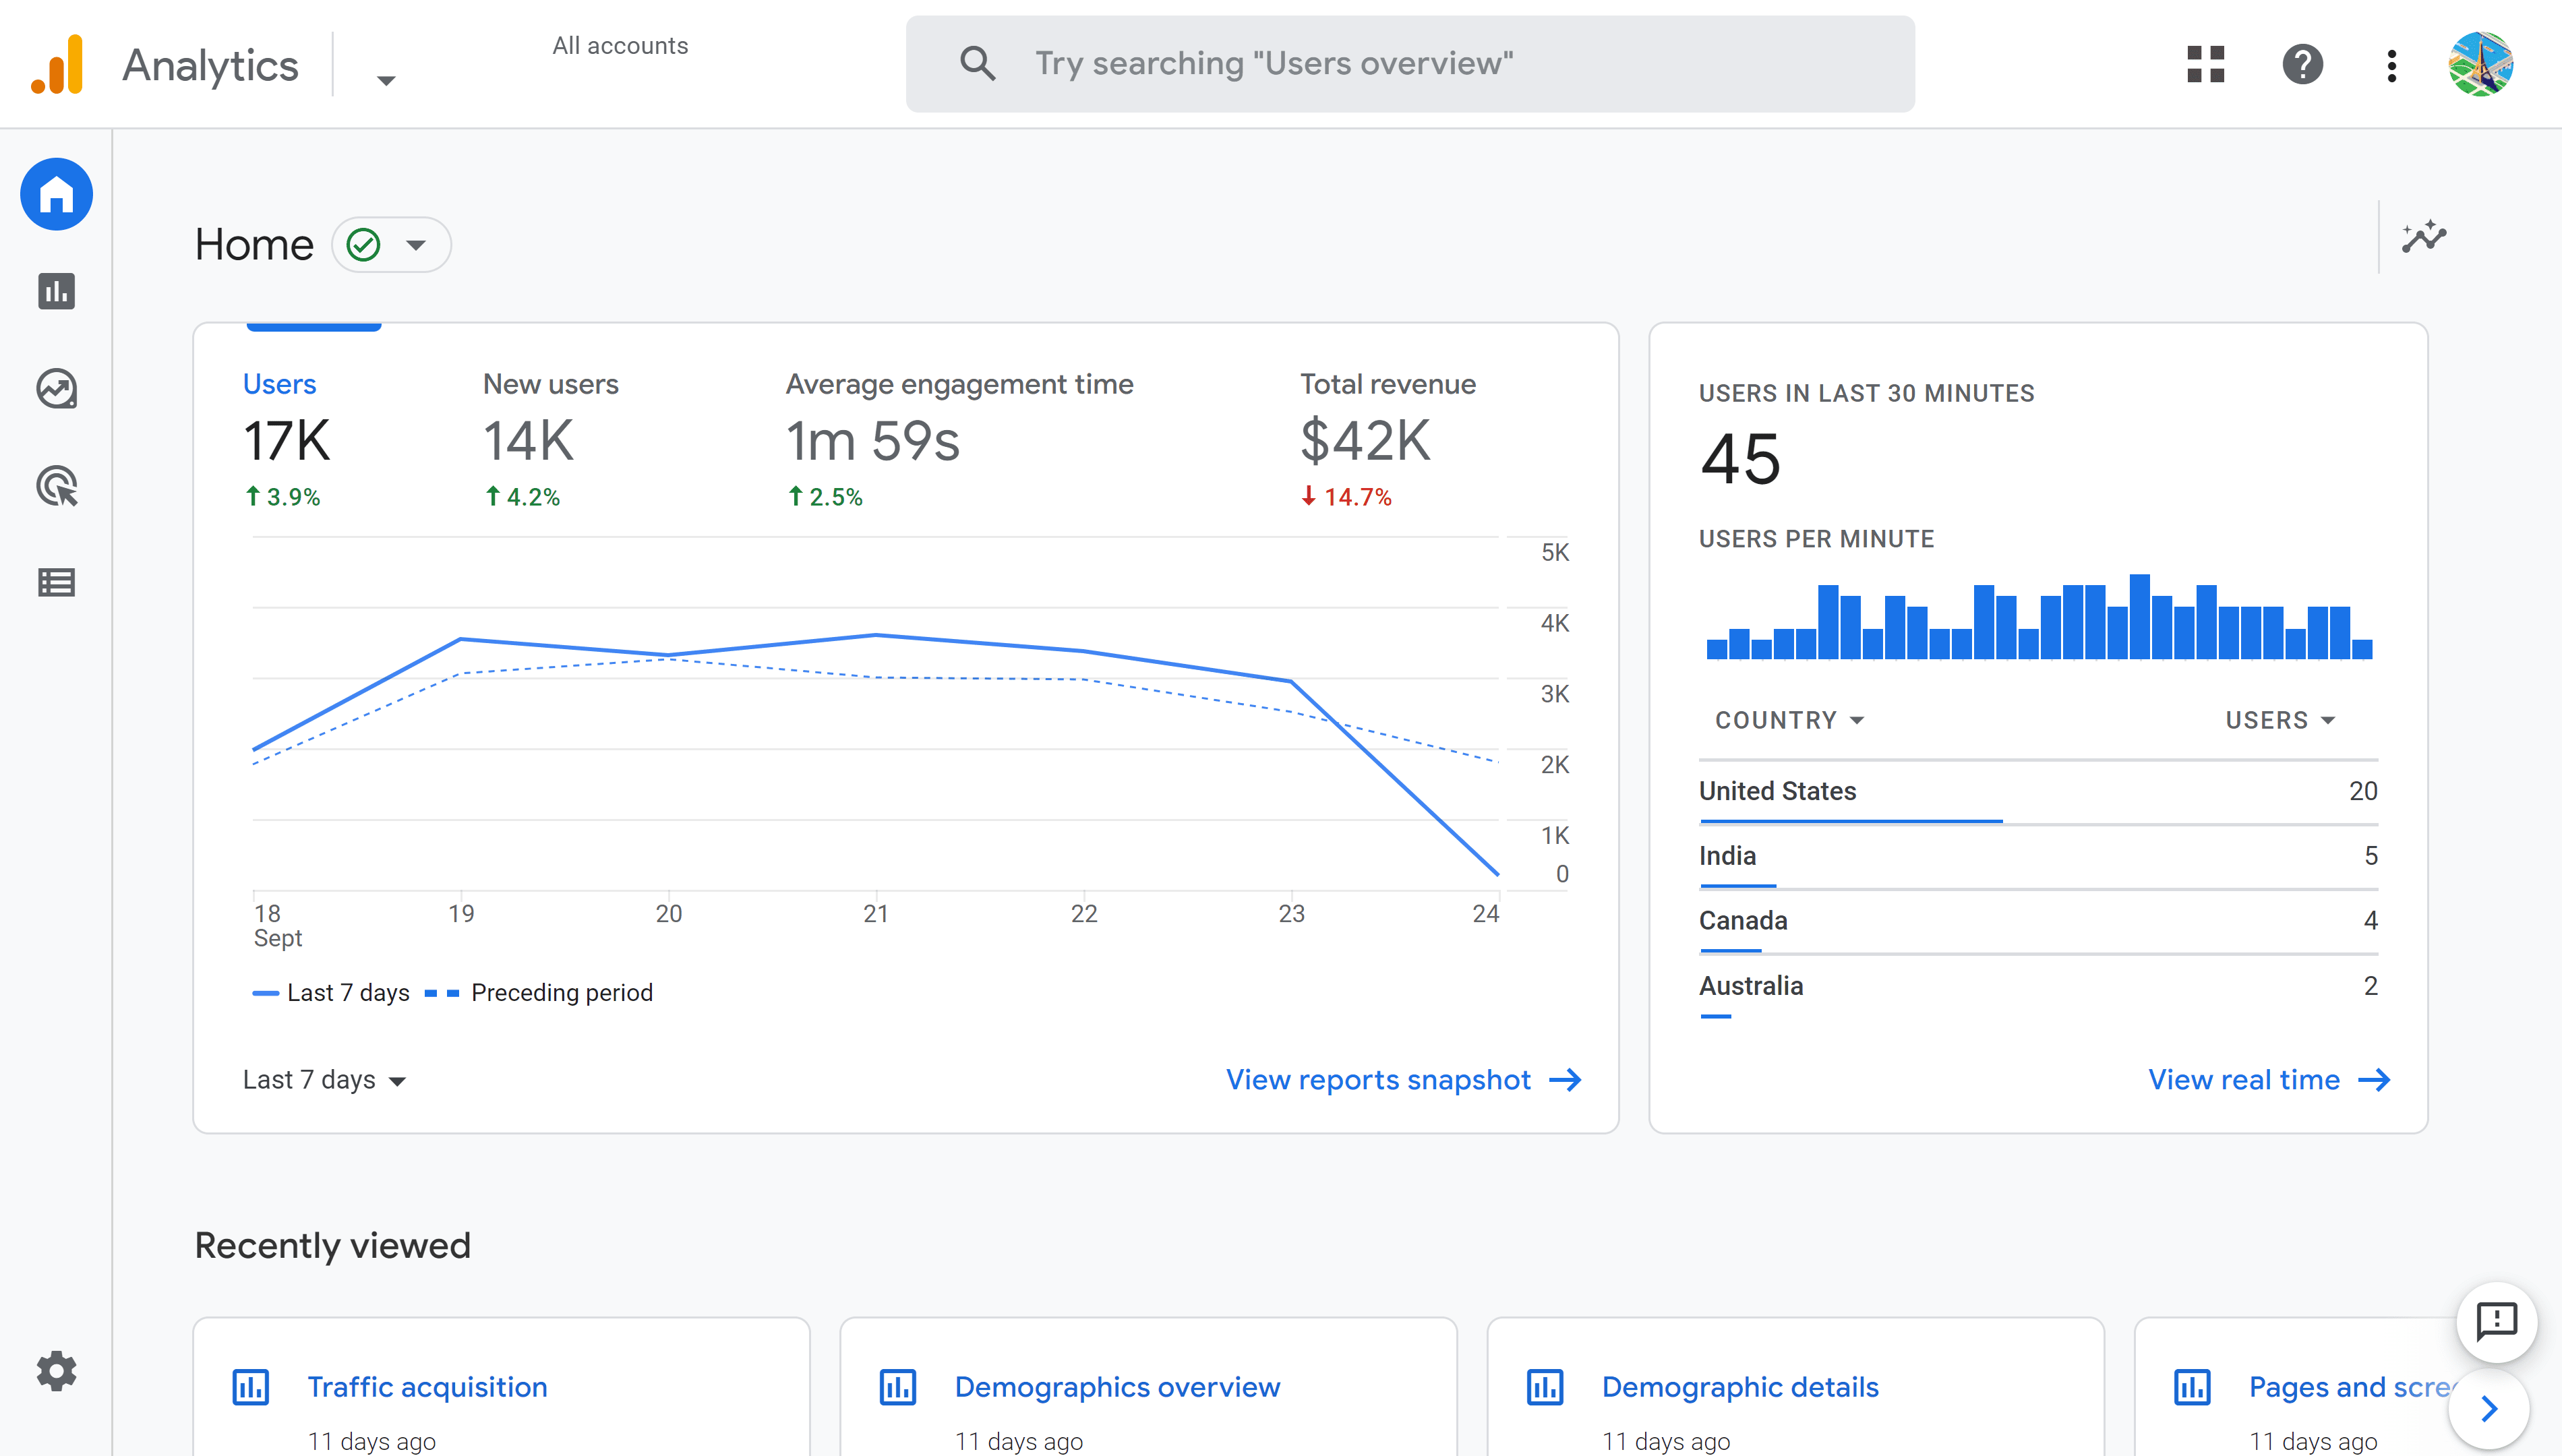
If you have more than one property, use the selector to the right of the Analytics logo to change property. The menu at the left-hand side of the screen will allow you to navigate to Reports, Explore, Advertising, Configure and Admin sections of Google Analytics. We will concentrate on the Reports menu in this guide.
Stay on the Home page to discover our first report based on data collected by Google Analytics.
This page shows data organized in blocks that Google calls “Cards”. The main two cards at the top of the screen are the Overview card and the Real-Time card. These are followed by cards that correspond to reports that you have recently viewed and then some Insights and recommendations generated by Google Analytics using AI (Artificial Intelligence).
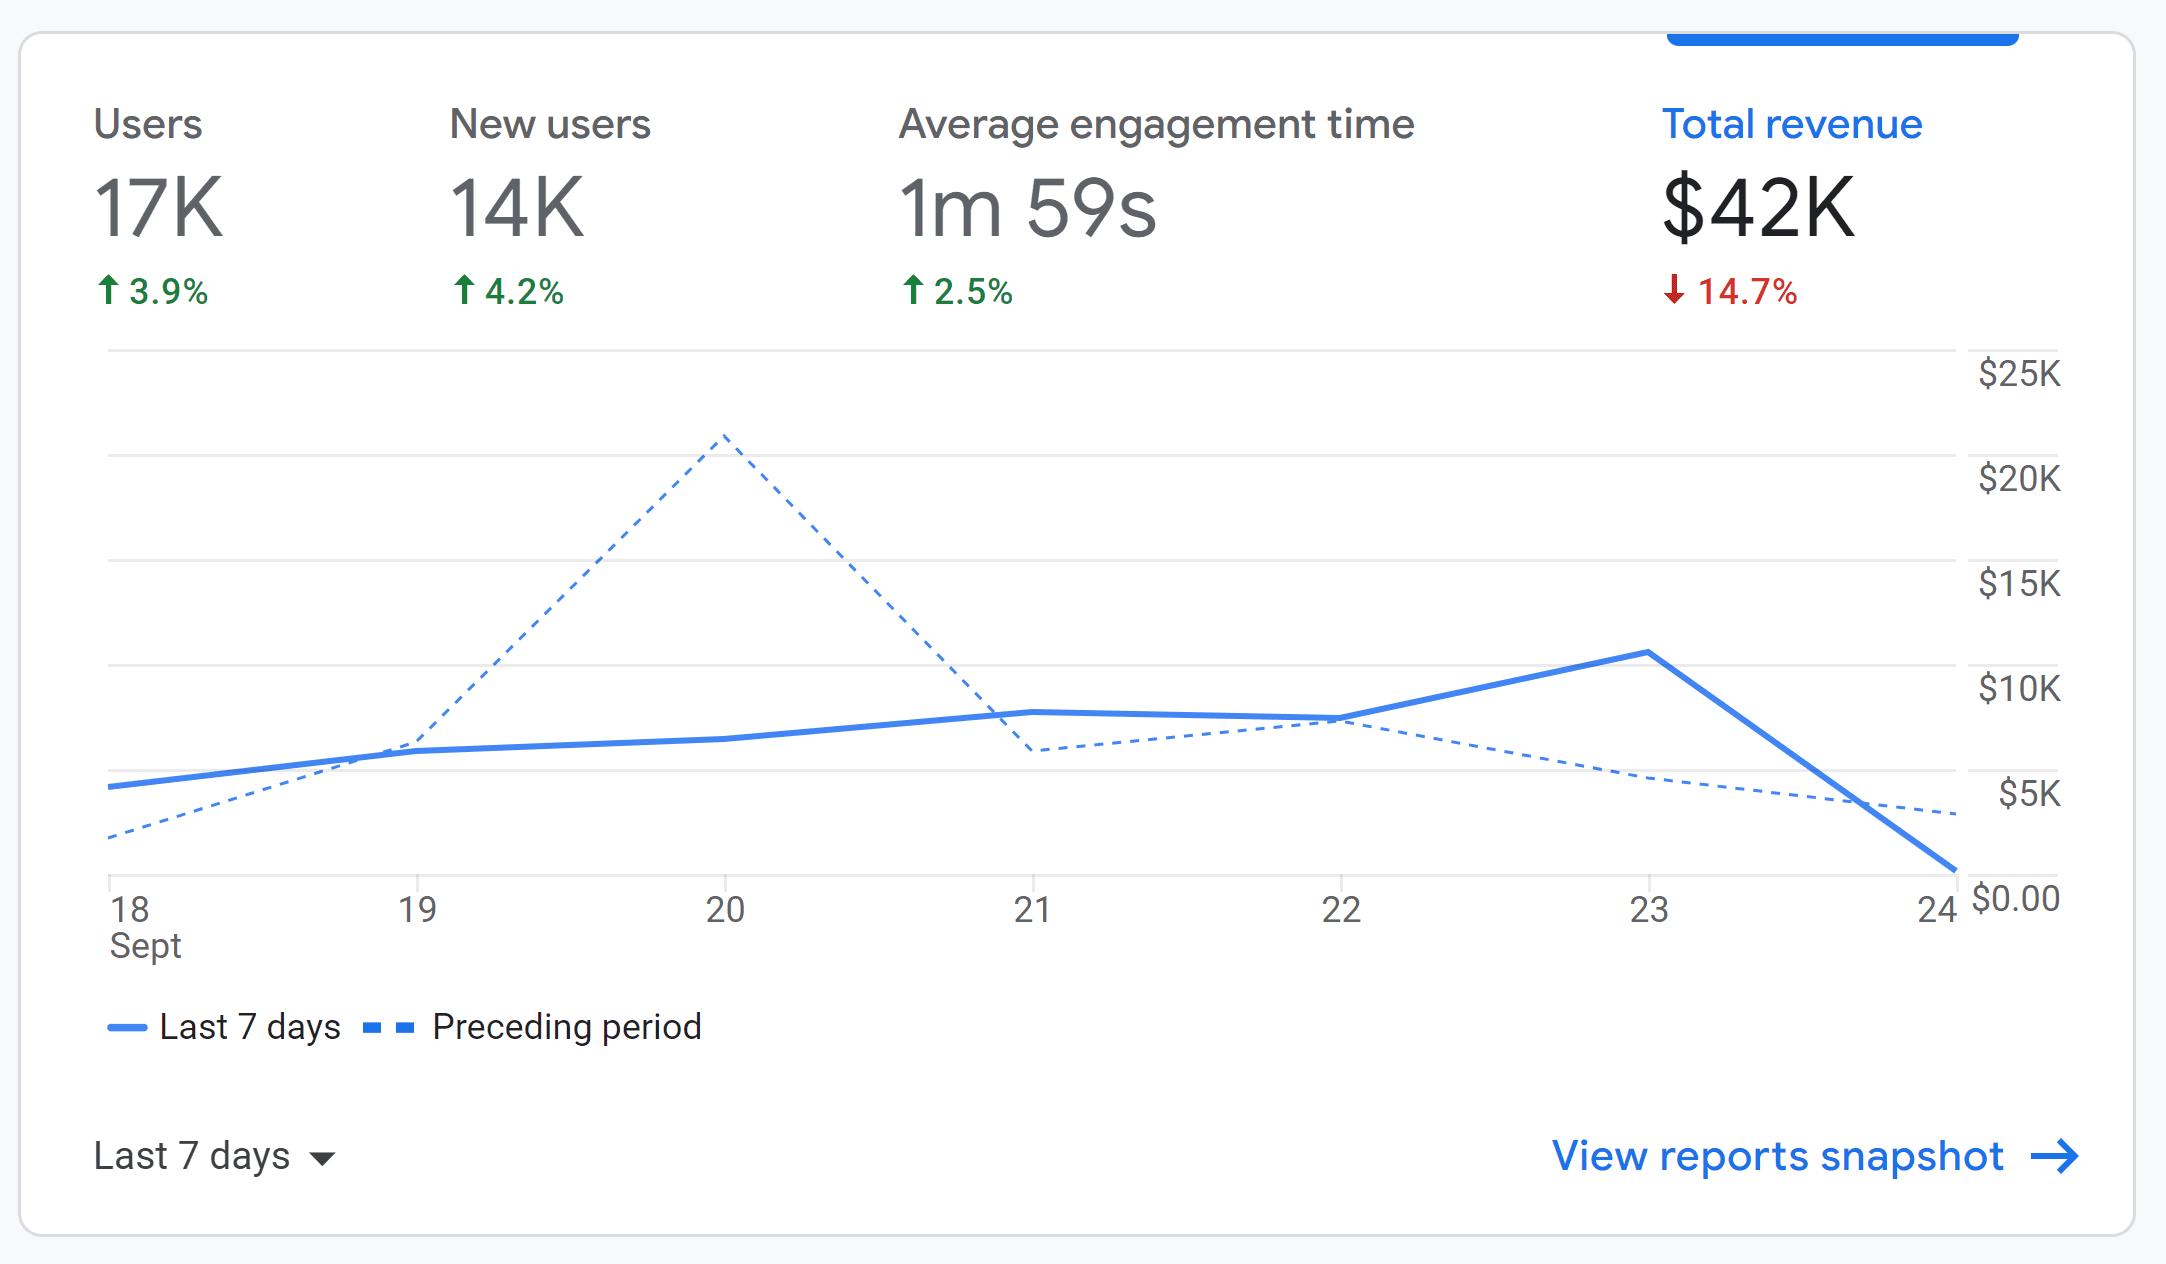
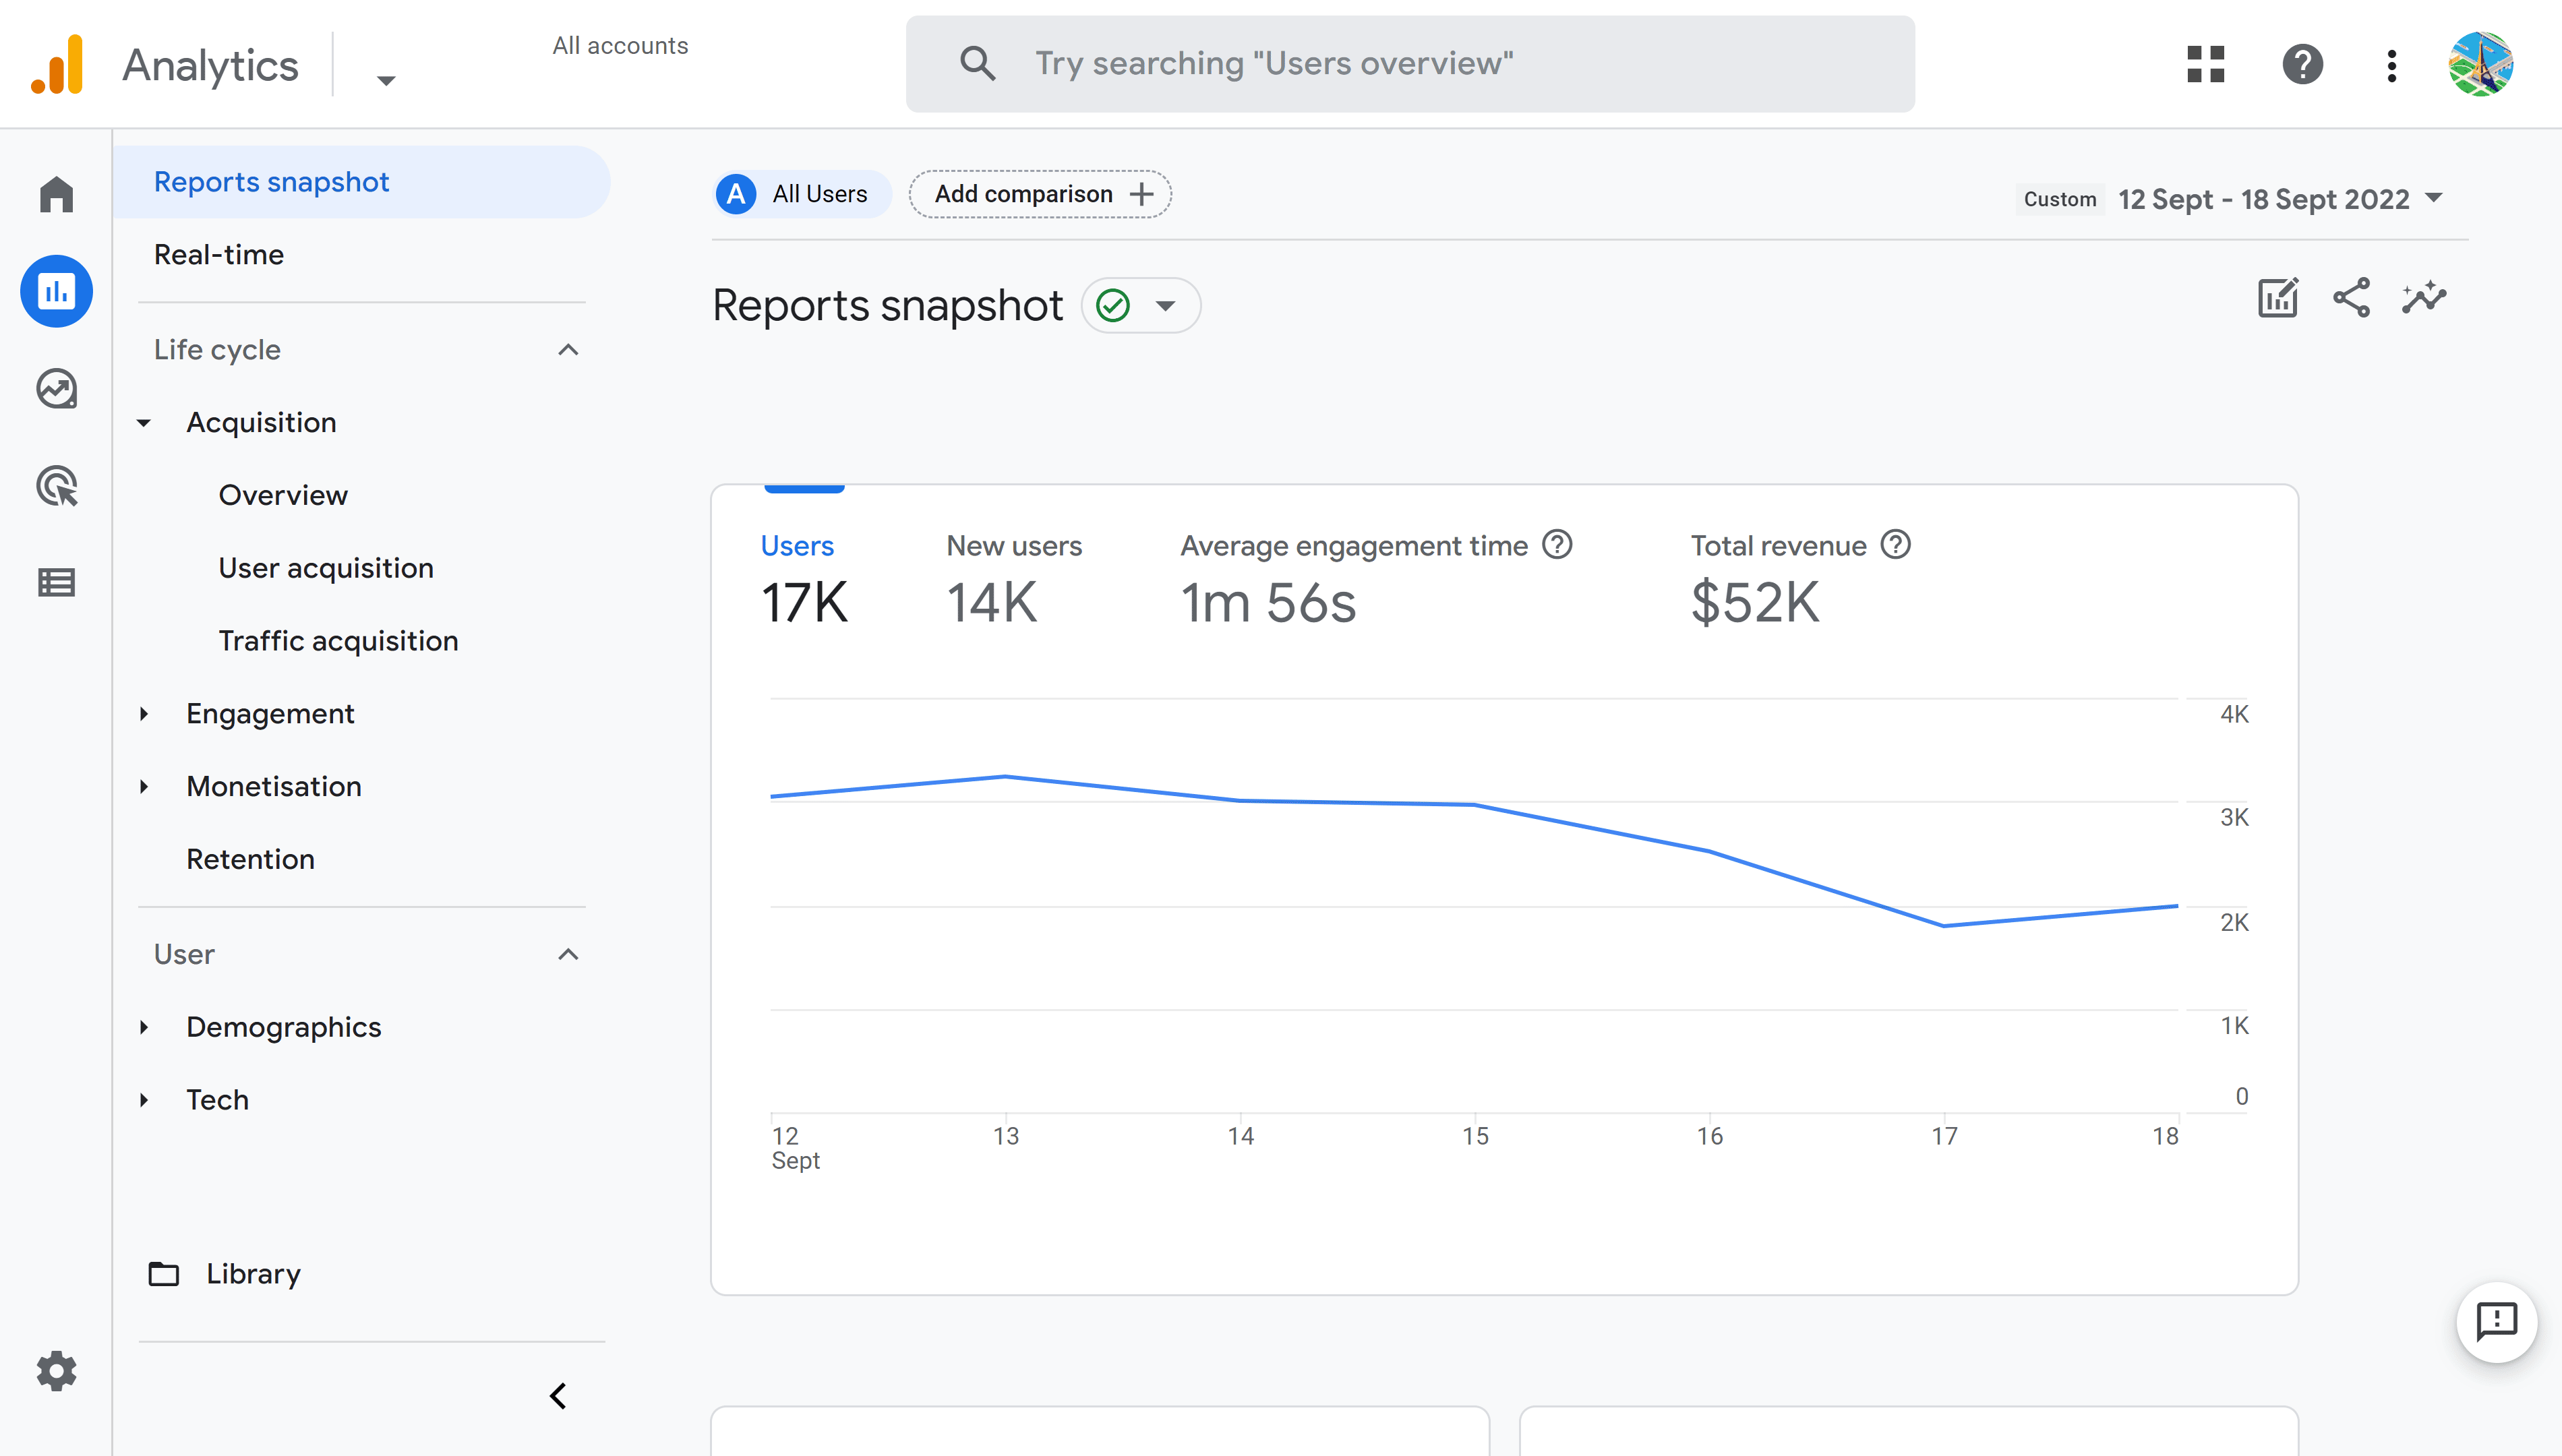
The Overview card shows up to 4 KPI (Key Performance Indicators) that you can also view plotted over time as a line chart. Click on a KPI to change the line chart underneath to correspond to that KPI. In the screen shot below, we have clicked on “Total revenue” – this KPI is highlighted by a blue bar above the KPI and the line chart has changed to represent this data with dates on the x-axis and revenue on the y-axis.
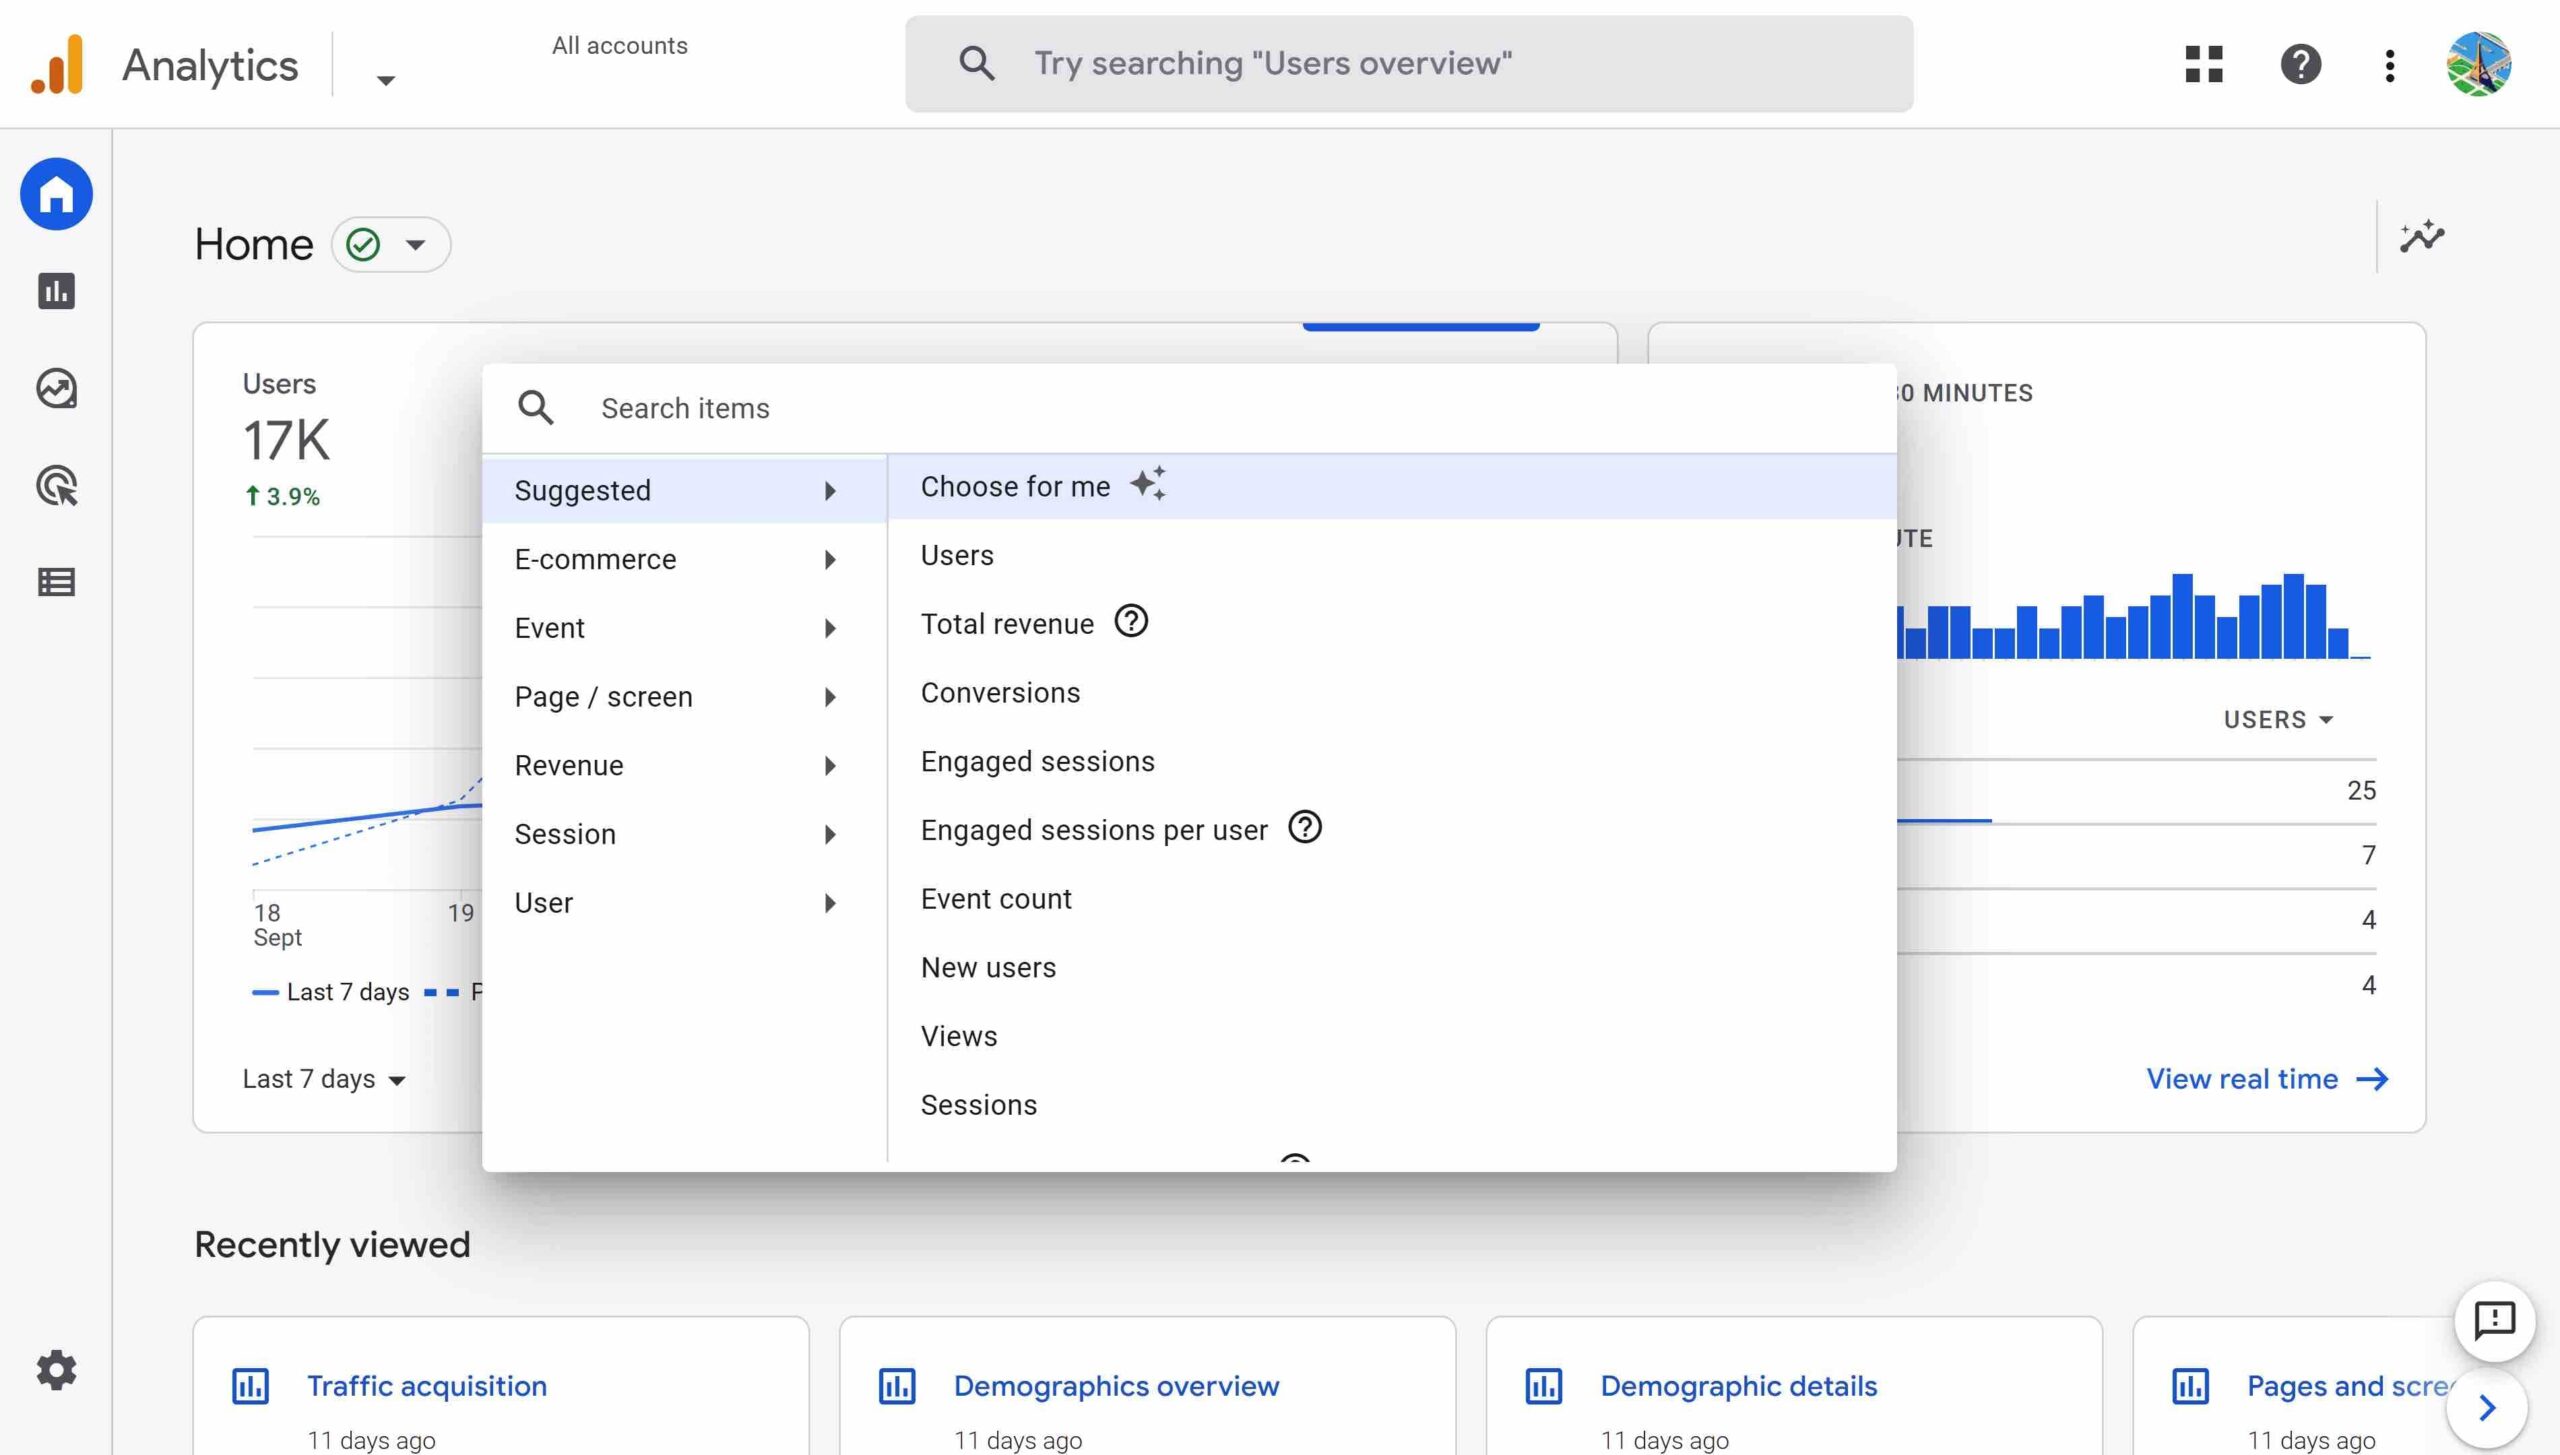
The 4 KPI that Google chooses by default are based on data that you view regularly in reports. By hovering your mouse over a KPI title, you will be able to click on a selector to choose another KPI.
By default, the KPI and charts are show for the last 7 days with a comparison with 7 days preceding that. In the graphs the solid blue line corresponds to the last 7 days and the dotted line the preceding period. In the screen shot below, see that there was a peak in revenues on the Tuesday two weeks ago, but not this week.
The figures shown for each KPI are the total for the last 7 days and underneath that, in smaller font-size, is the percentage change compared to the preceding period. You will notice that Google rounds larger figures up to the nearest hundred, thousand or million. In the example above, “17K” is displayed for 16,811 users.
The percentage figure will be green if the change is positive (for example a positive increase in users) and red for a negative change (for example, a drop in revenues last week compared to the preceding week).
By clicking on the link View reports shapshot, you can open the Reports snapshot report (see below).
The Real-time card on the Home page shows real-time data collected in the last 30 minutes. Data in this card is refreshed every minute while the page is open.
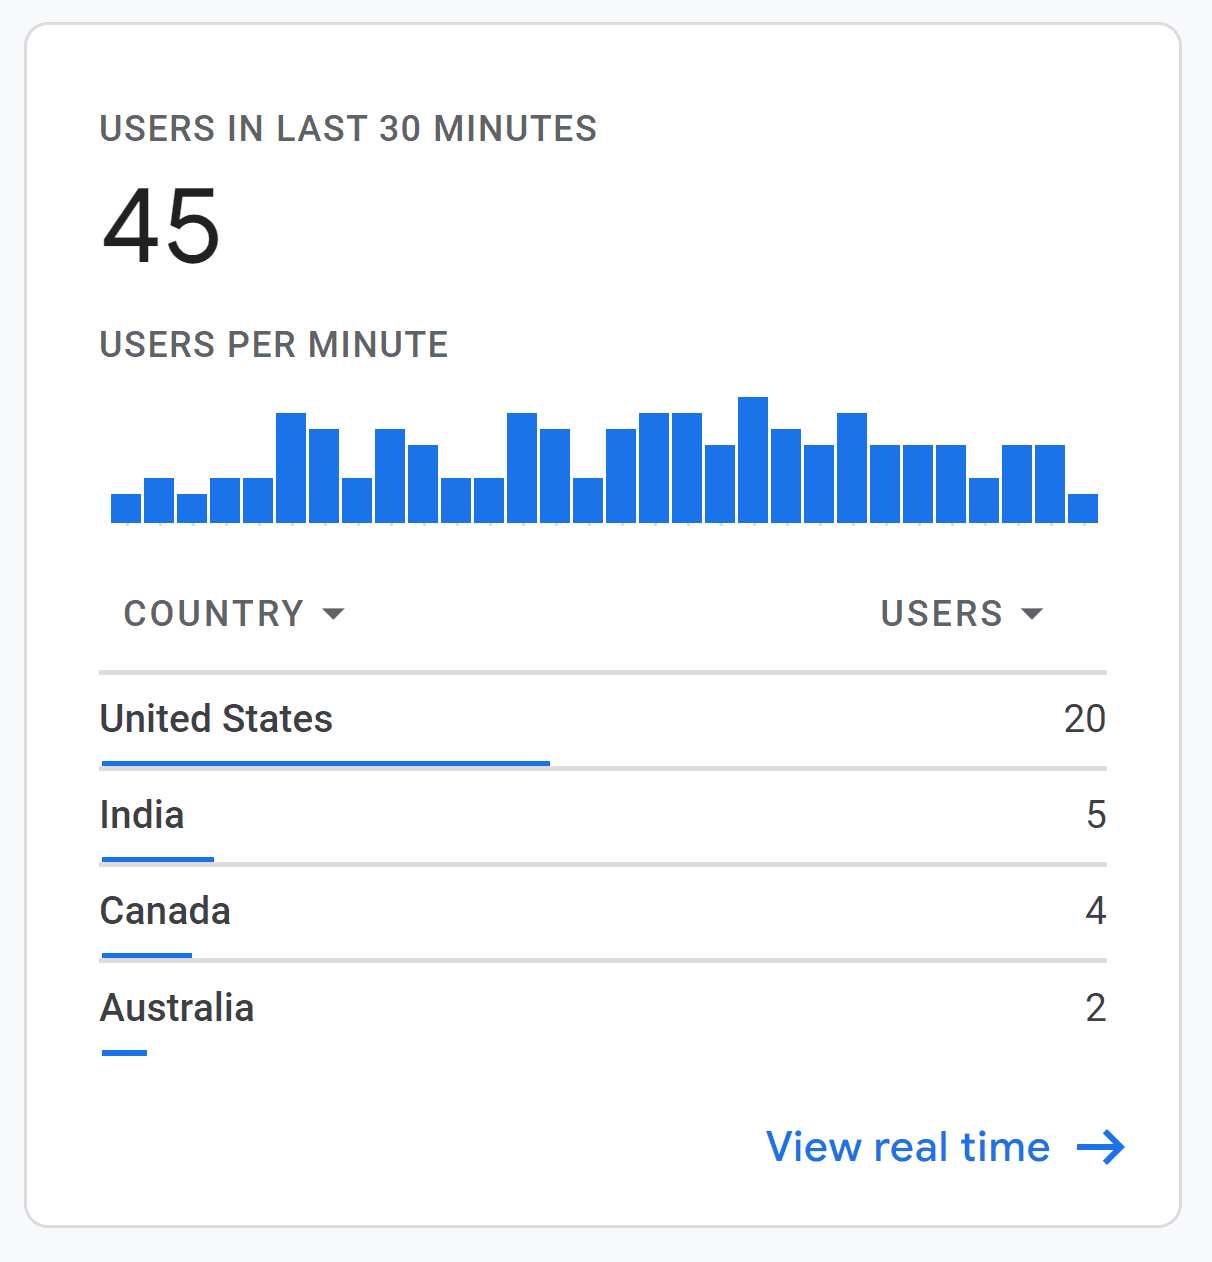
In this example the card shows a first chart with the number of users per minute and under that a table showing the number of users per country. By clicking on the selector next to COUNTRY and USERS, you can choose other “dimensions” and “metrics”.
Clicking on the View real time link opens the Real time report (see below).
Google Analytics standard reports
Moving down from Home to Reports in the left-hand menu, you can open the Reports menu to get an overview of reports available for your Google Analytics property.
After the Reports snapshot report and Real-time report, the other standard reports are organized in the sub-menus Life cycle and User. The Life cycle reports are organized by Acquisition, Engagement, Monetization and Retention. User reports are organized in Demographics and Tech sections.
We won’t go through all these reports. We will focus on 3 reports that will allow you to discover the most important features of the Google Analytics user interface.
Reports snapshot
The Reports snapshot shows a report that is familiar from the overview page. It shows a card with 4 important metrics for your site and allows you to view graphics for each of them.
Date picker
The importance difference in this report compared to the Home page is the date picker. By default, data in this report corresponds to the last 30 days with no comparison to a preceding period. You can completely personalize the dates of the report and add comparisons by clicking on the date range displayed in the top-right hand corner.
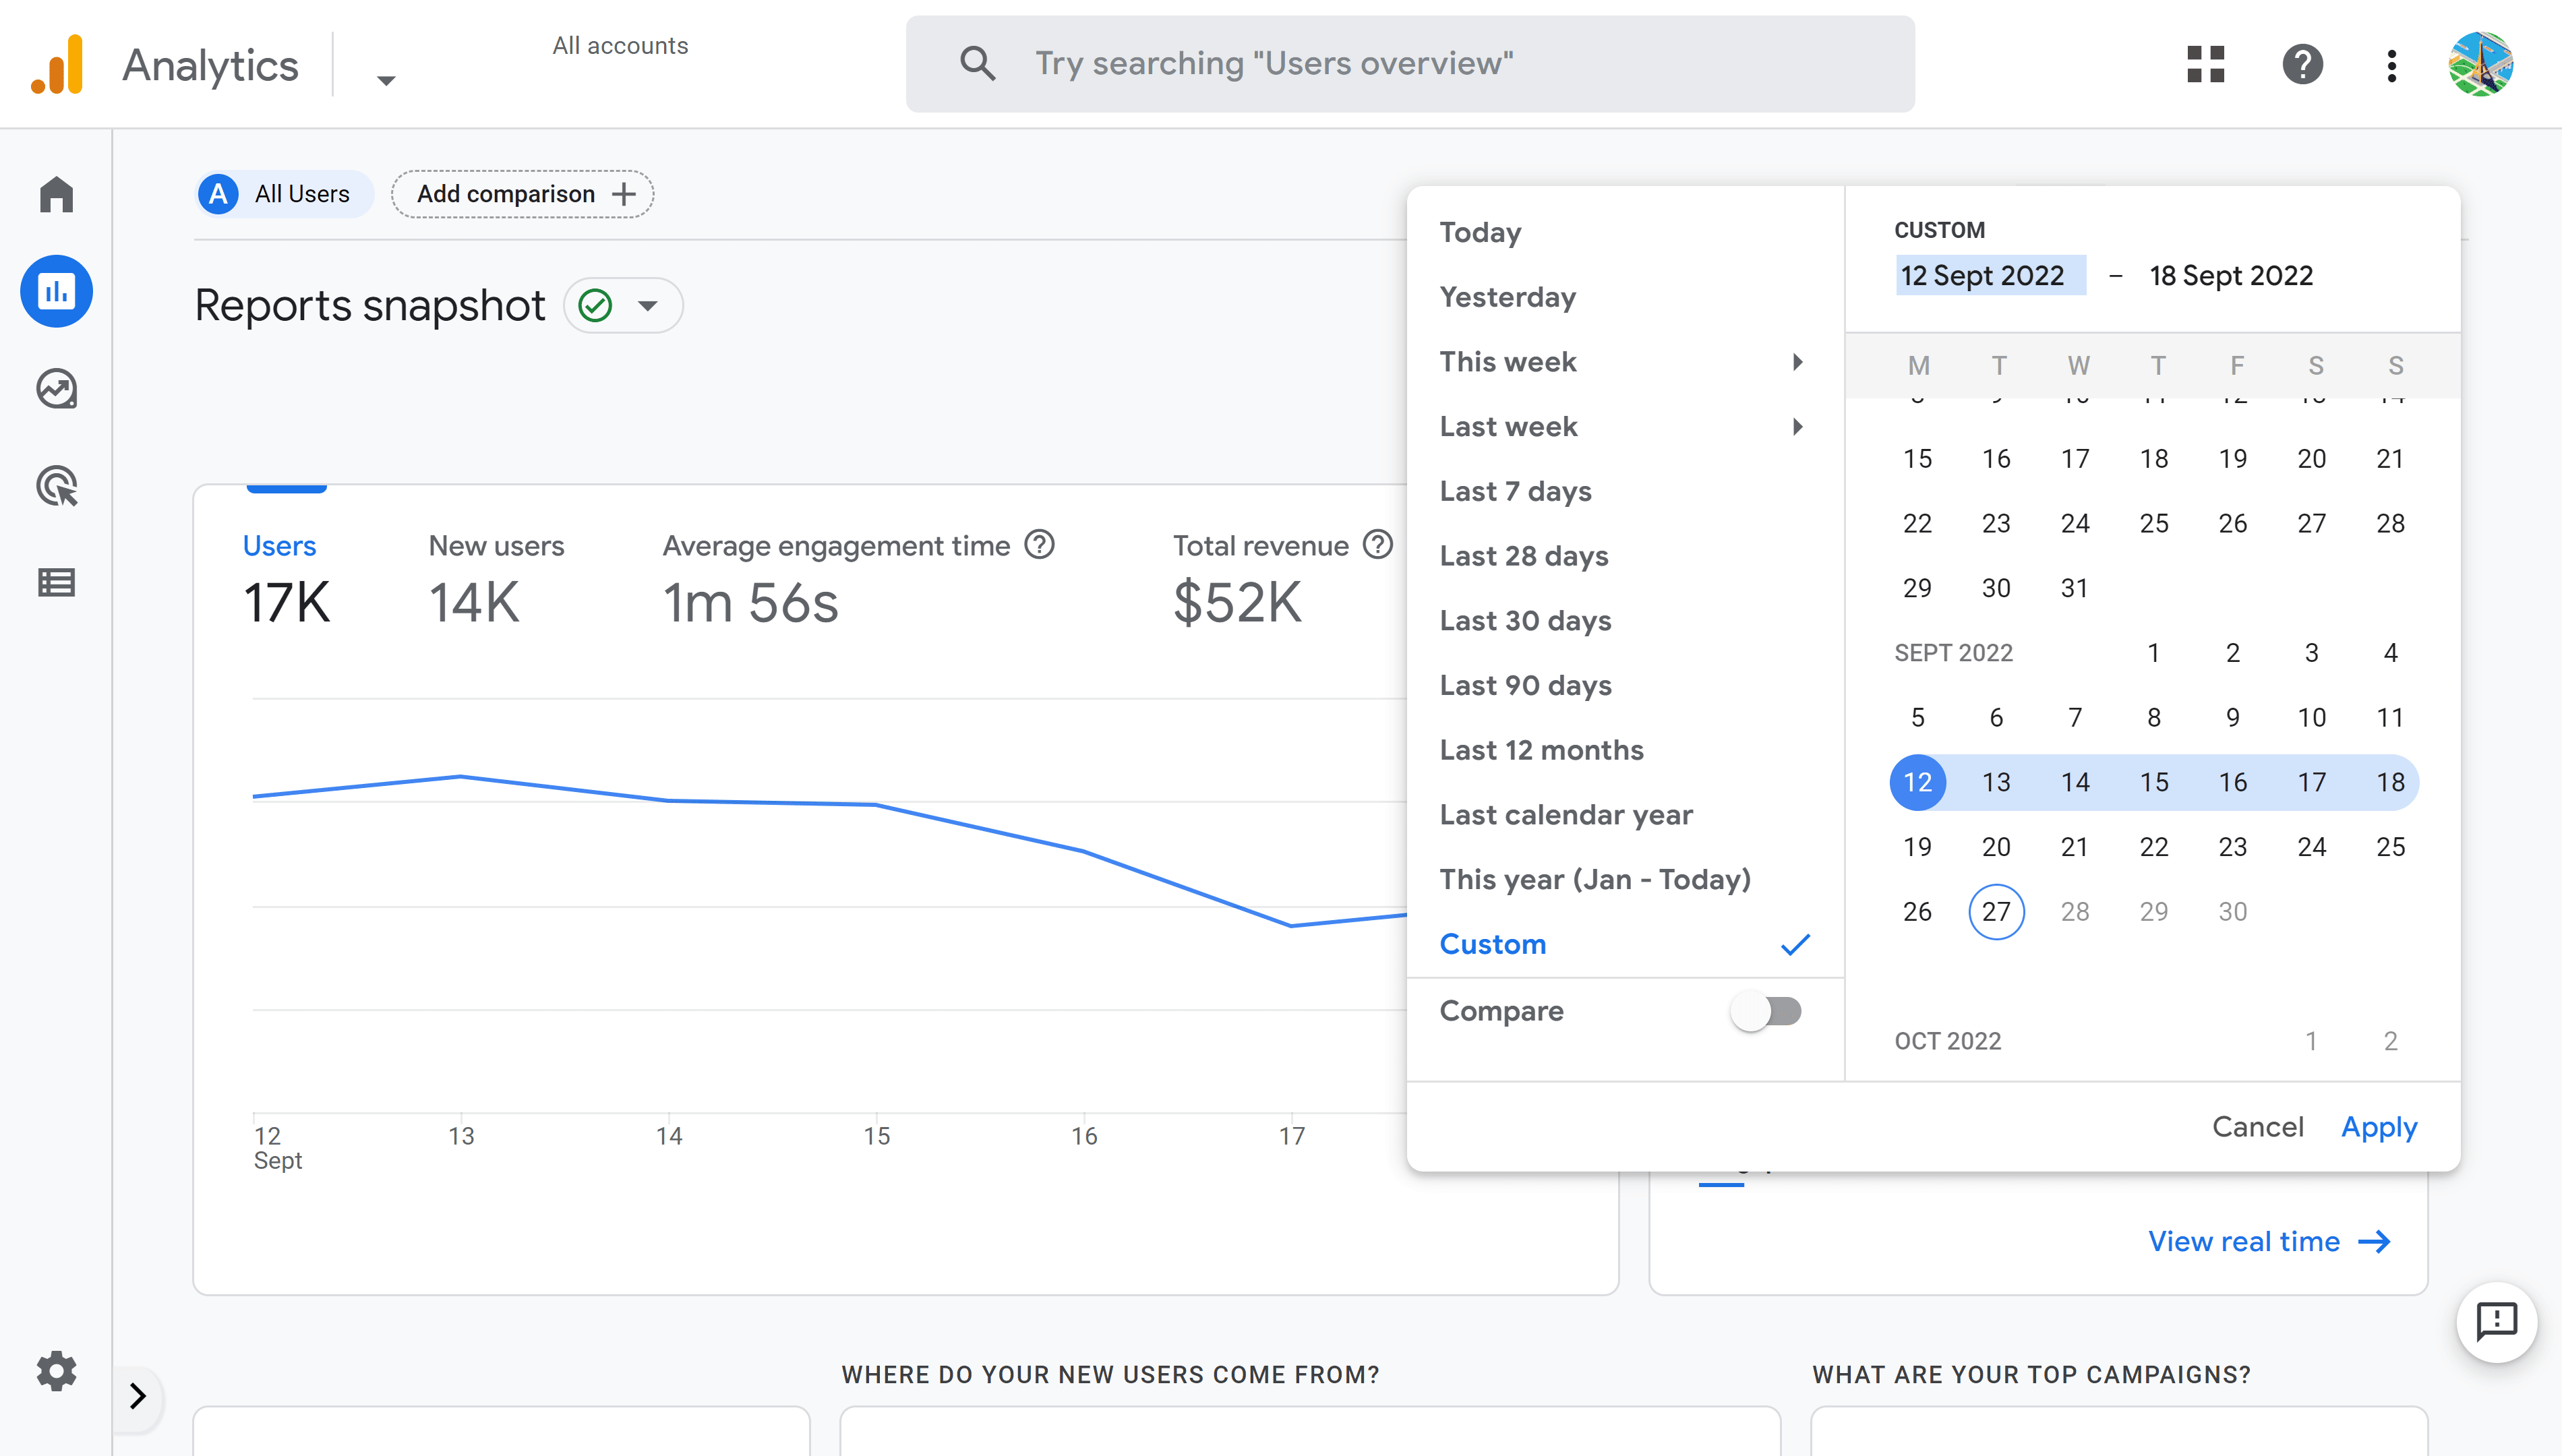
This is a popular feature of Google Analytics and is available in all standard reports except the Real-time report. Comparing KPI with previous periods allows you to measure improved performance over time, or inversely, detect and analyze traffic-drops.
After changing the time range on one report, Google Analytics will maintain the same time range for every further report you review.
Comparisons / Filters
Reports can also be filtered by various criteria and two sets of filtered data can be compared using the Add comparison button. You can find this just above the report title and next to All Users.
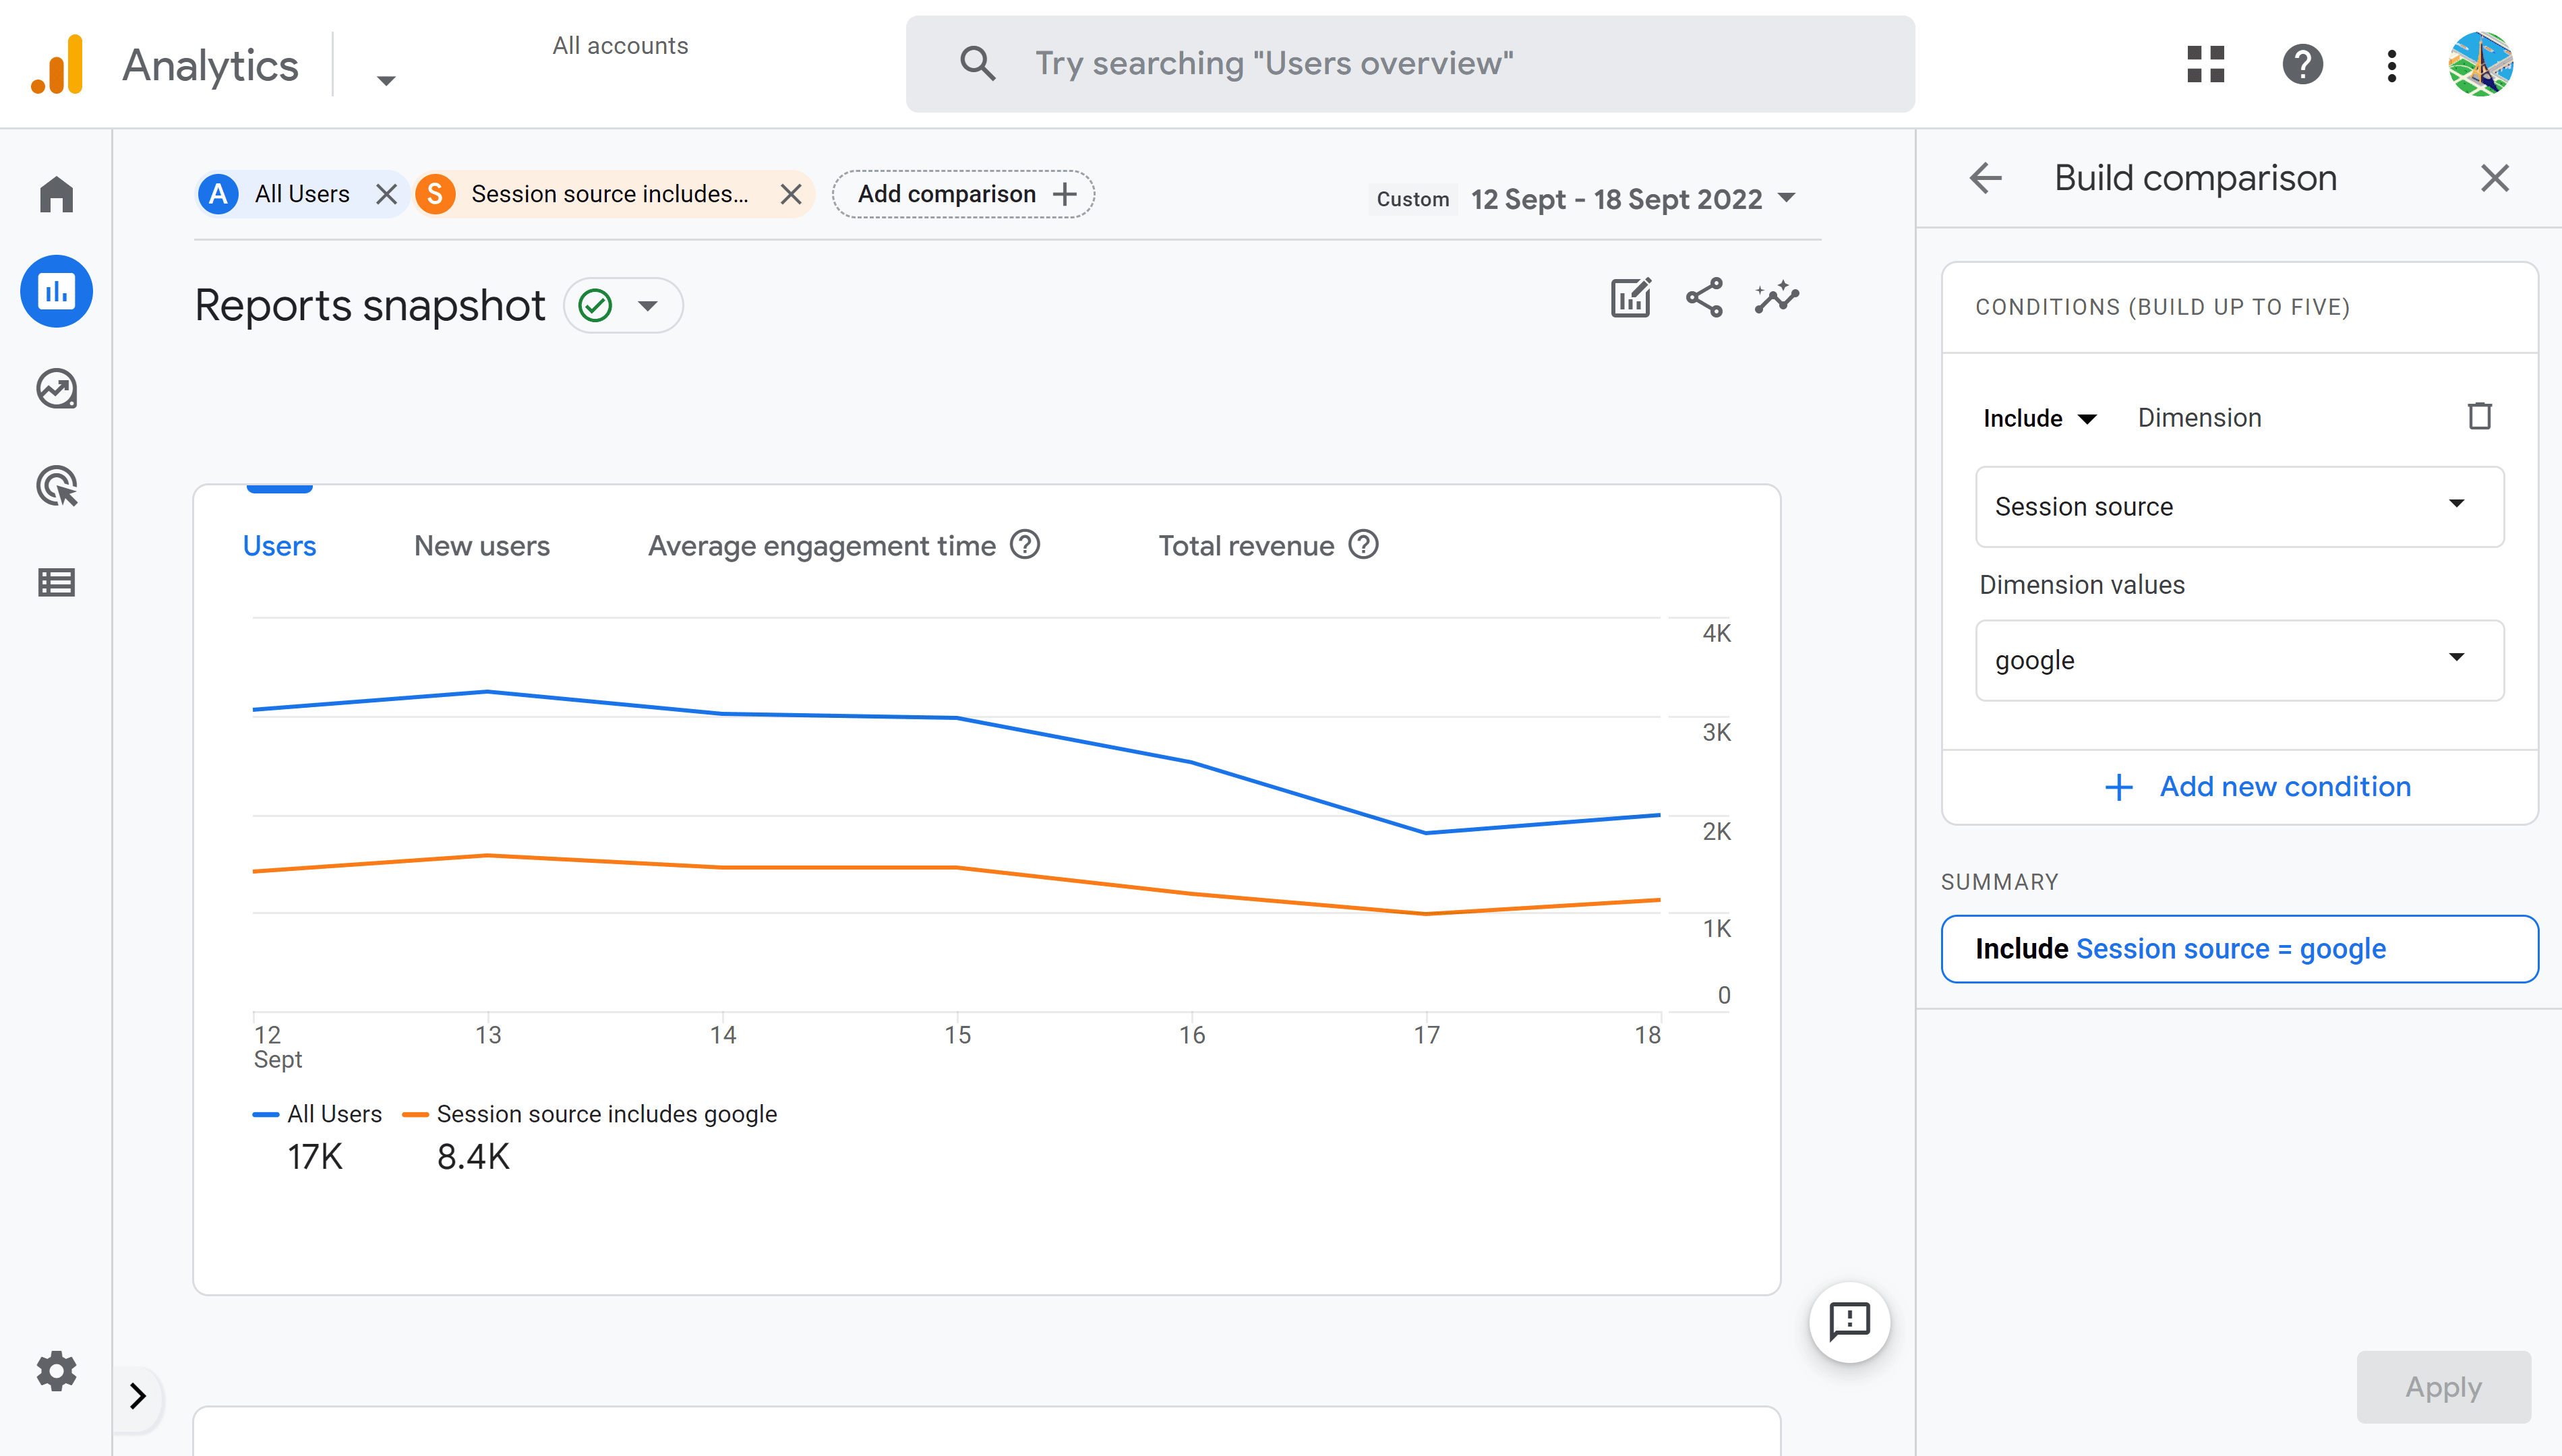
This feature allows you to filter data on certain conditions. In the illustration above we have compared All users with traffic from Google. The blue line in the graph is the total number of all users whereas the orange line is the number of users that came from the Session source “Google”. Traffic to the site dropped significantly at the weekend, but the drop was less significant for traffic coming from Google.
Session source is one of many “Dimensions” you can use to filter data. Dimensions and metrics are the building blocks of Google Analytics Data. Some of the dimensions that you may find useful are
- Session source / medium – filter traffic by sources with detail of medium. For example “google / cpc” and “google / organic”. These sources both come from Google, but the first is by the medium “cpc” (Cost per clic – i.e., Google Ads) and the second is by the medium “organic”.
- Country – filter traffic on a specific country
- Device category – filter traffic on device type (mobile, desktop, tablet, etc.)
- Page_url – filter traffic by a specific page (only show users who saw a particular page during their visit)
Again, this is a powerful feature that allows you to get answers to specific questions you may have about your traffic.
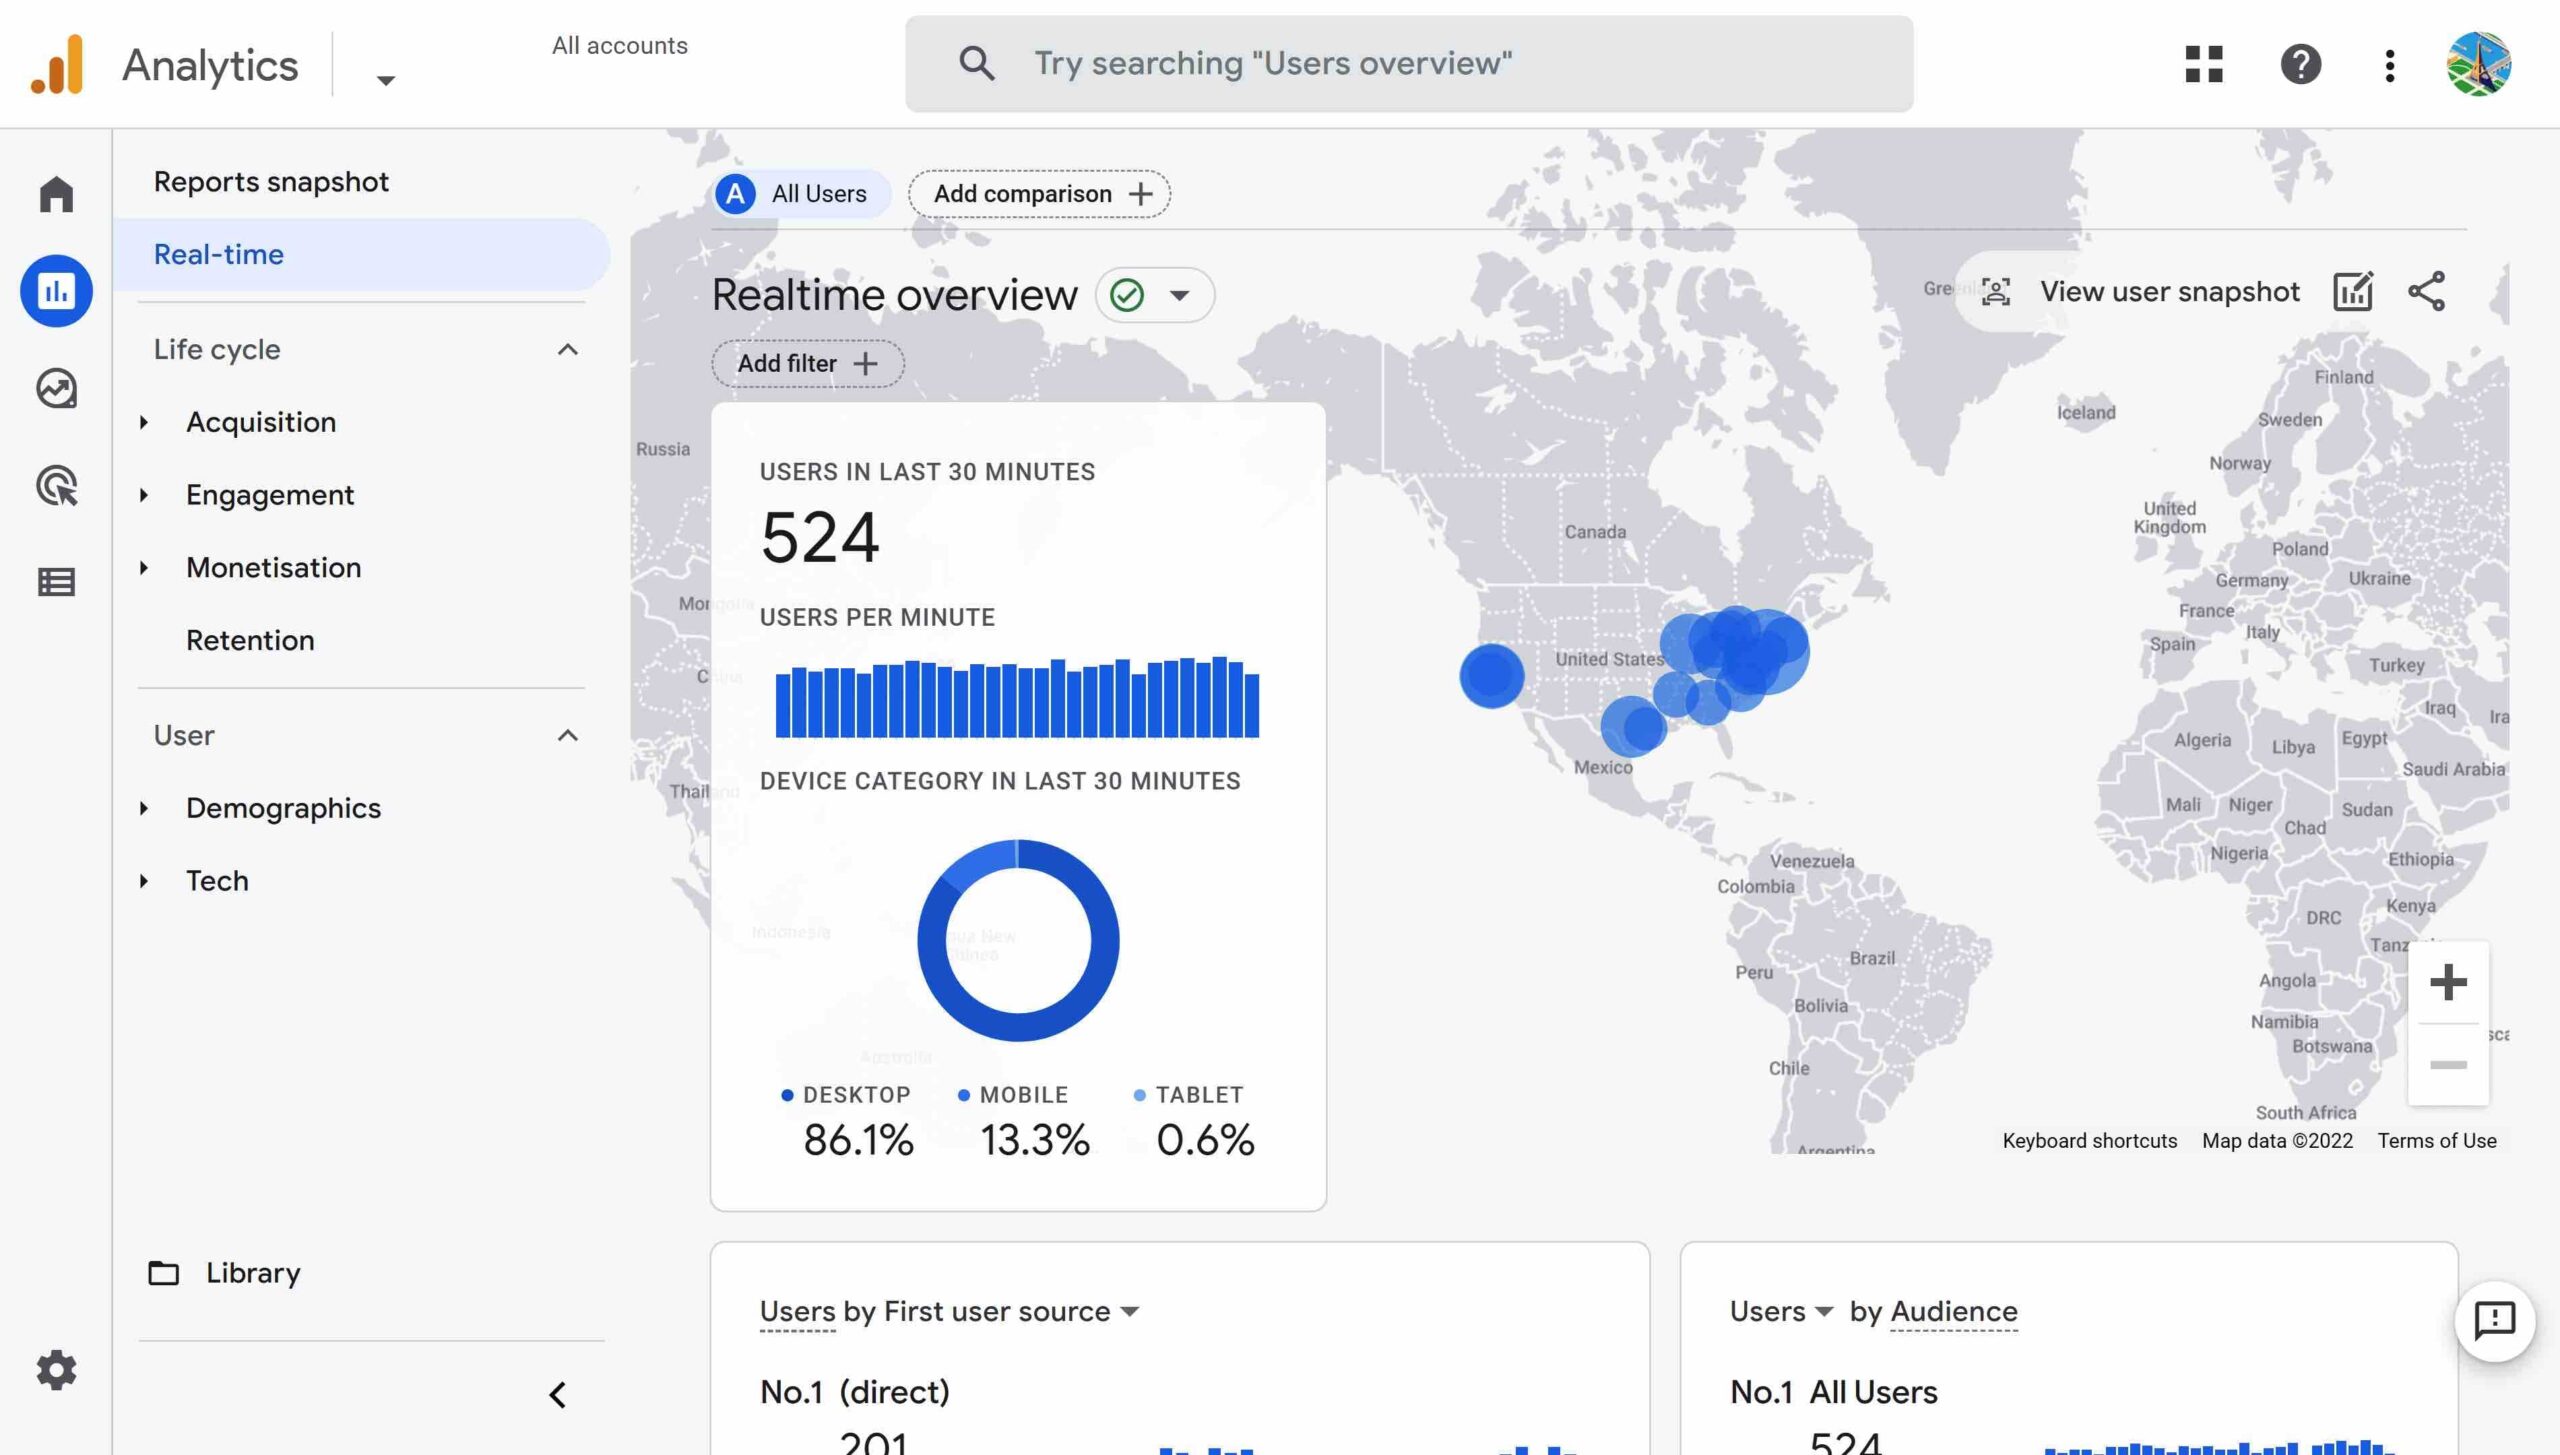
Real time report
The real time report shows data collected in the last 30-minutes and gives you an interesting insight on what is happening on your site right-now. It is animated and updates every minute. A world-map shows the geographic location detected for recent users as well as the total number of users, a bar chart showing the number of visitors per minute and the breakdown of devices used (desktop, mobile and tablet).
More insights into real-time visits are shown further down the page, but before scrolling, locate and click the View user snapshot button at the top right-hand corner of the map.
User snapshot is an amazing feature in Google Analytics 4 that allows you to see a timeline for individual sessions. As well as giving you an insight into how users interact with your website, it also gives you and insight into what data Google Analytics collects and when. Click on the arrows at the top of the screen to scroll through current or recent users.
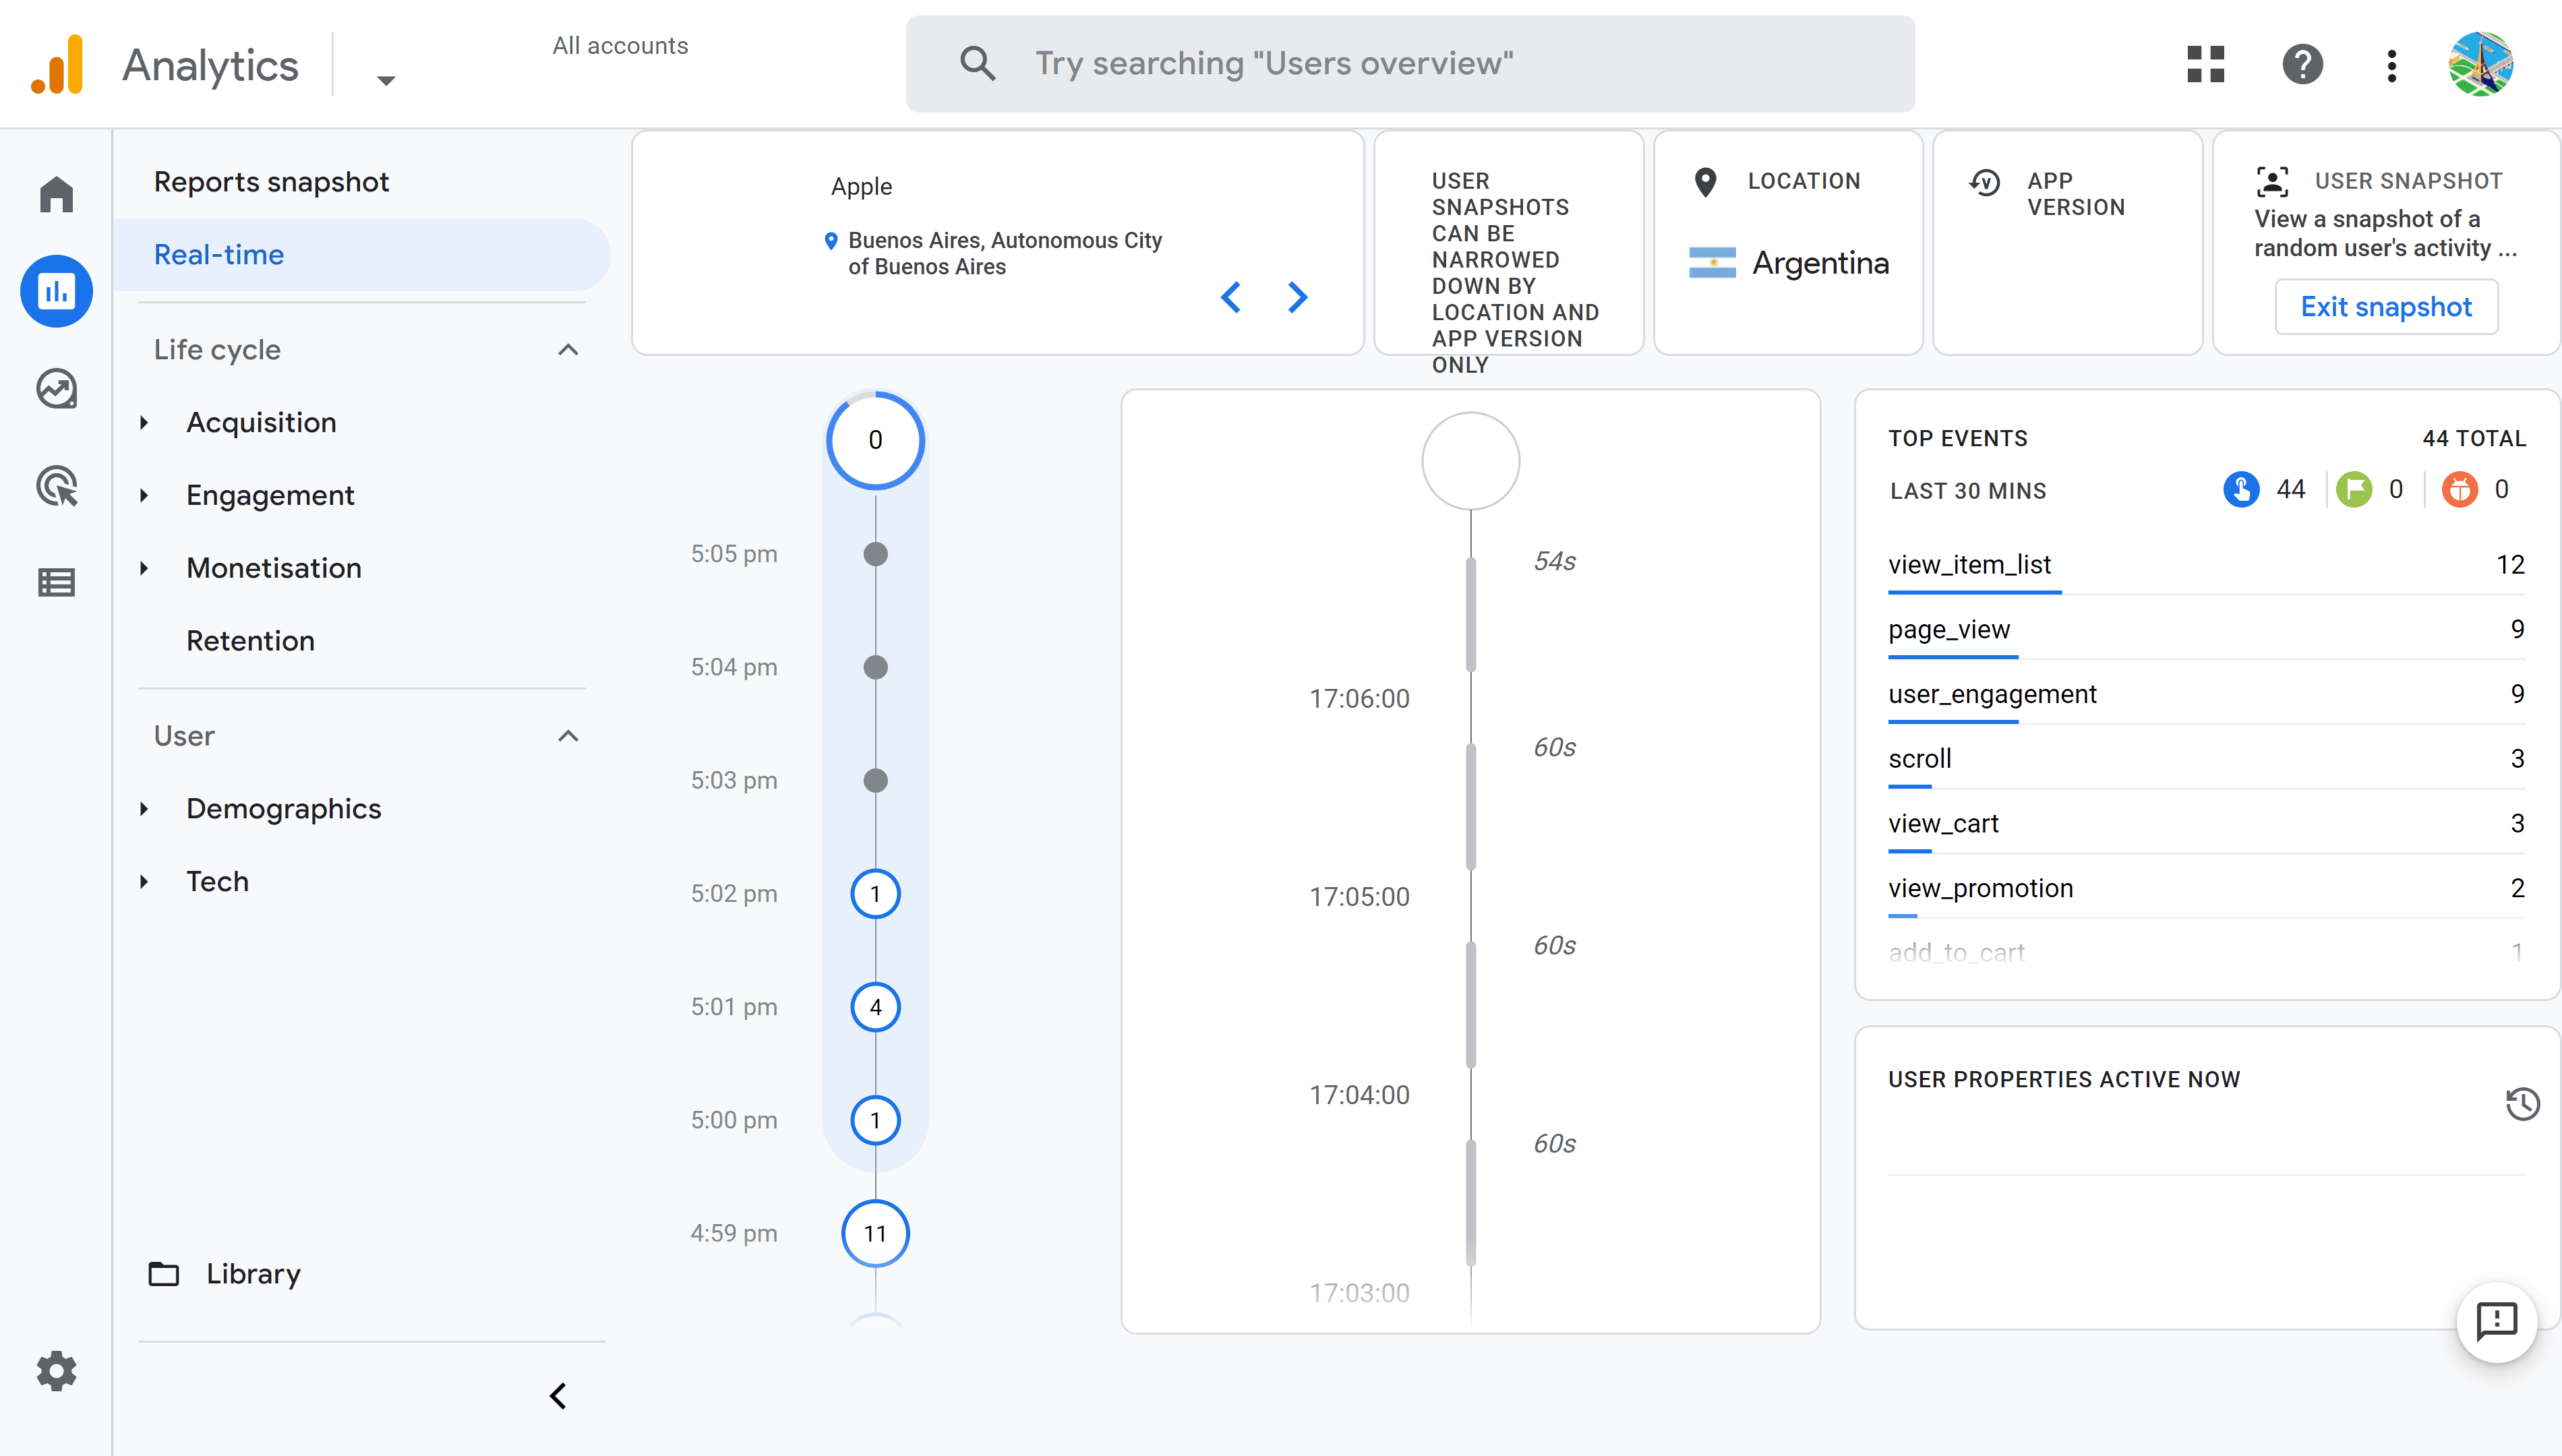
In this example we can see a session recorded by a user from Buenos Aires, Argentina. In a session that started at 4:50 PM, 44 different events were recorded in this session including 9 page_views and 1 add_to-cart, but this visitor did not complete their purchase – yet. At 5:05 PM no action has been recorded for this visitor since 5:02 PM, but there is still time for him to complete his purchase.
Watching live users can be addictive! You can learn about user behavior from watching many users, but it is better to analyze traffic using aggregated data from many users before drawing too many conclusions. The remaining standard reports in Google analytics are based on historic data.
Life cycle – Acquisition – Traffic acquisition
The Acquisition section of Life cycle reports contains 3 reports: Overview, User acquisition and Traffic acquisition. We will go directly to the Traffic acquisition report to analyze data on the source of traffic and discover a new type of data visualization, the table.
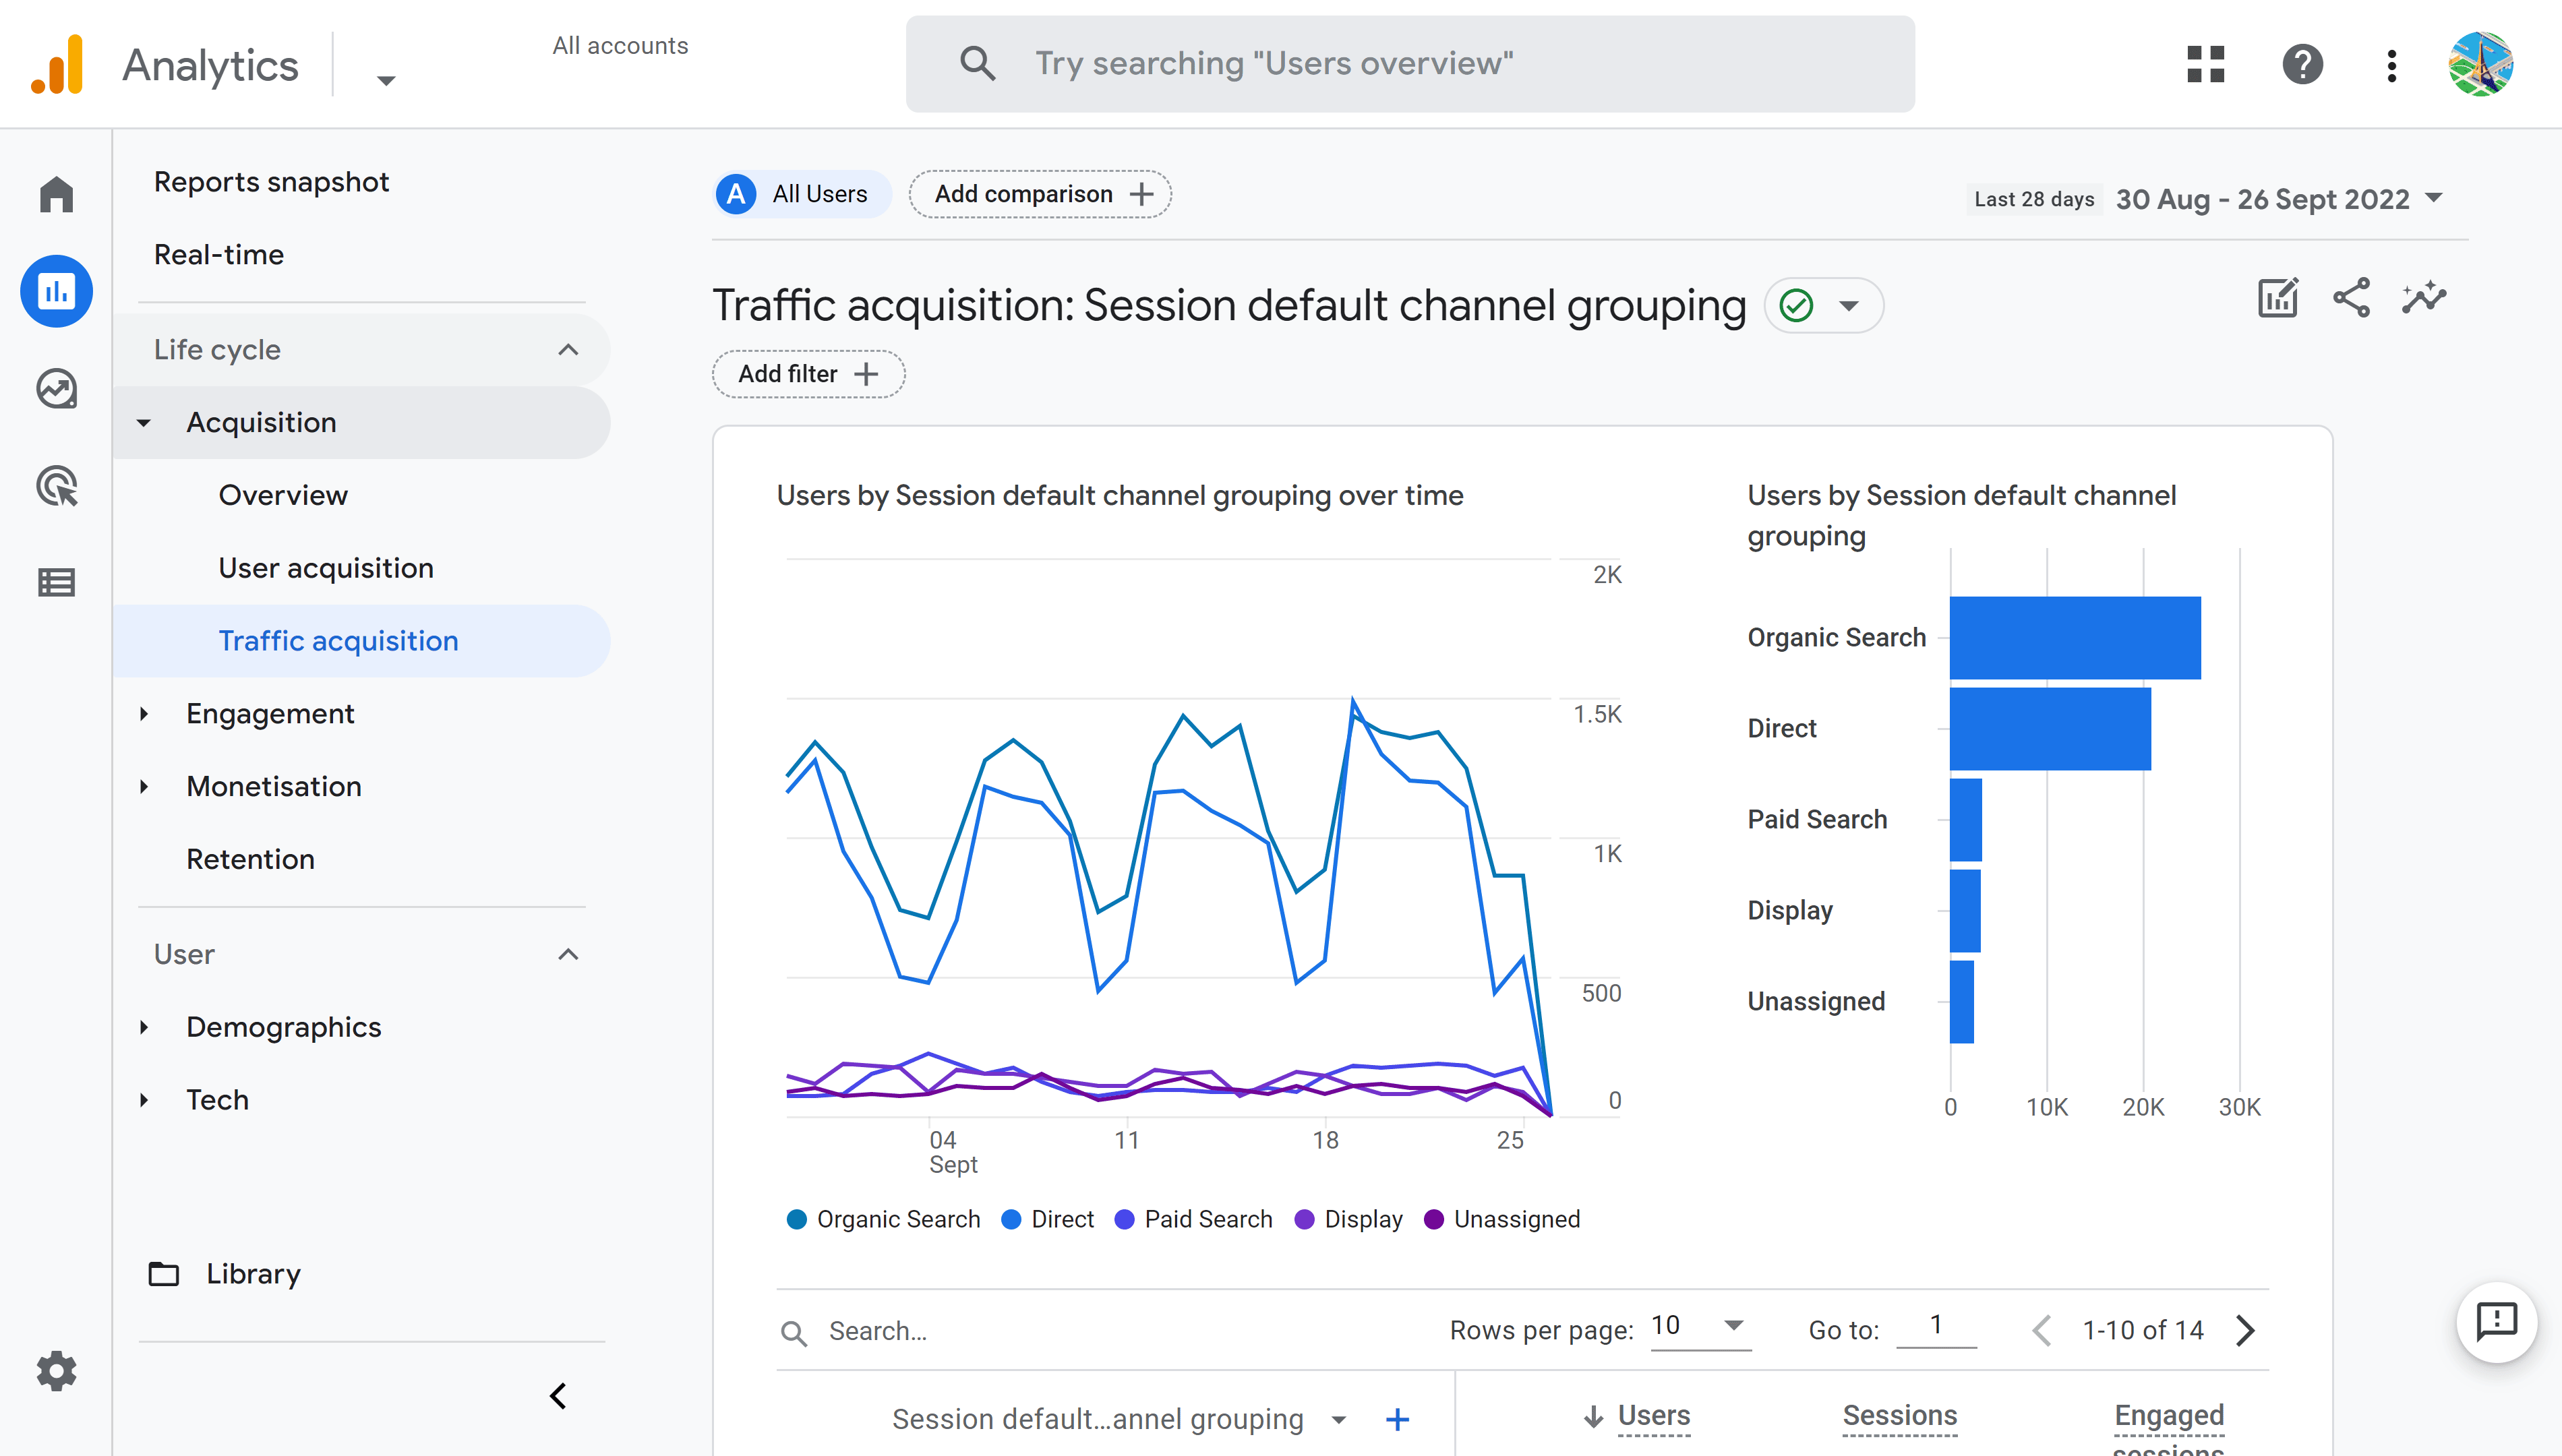
The first two cards in the report are “Users by Session default channel grouping over time” and “Users by Session default channel grouping”. These show data on traffic sources as a line chart and then a bar chart.
Each visit by a user is called a “Session” in Google Analytics. Session default channel groupings are a way of grouping sources of visits into a small number of categories to make reading reports easier.
Typical channel groupings are
- Paid Search – traffic from paid ads on search engines (SEA)
- Organic Search – organic traffic from search engines (SEO)
- Display – traffic from banner ads
- Organic Social – traffic from social networks
- Referral – traffic from sites other than social networks and search engines
- Email – traffic from emails or newsletters
- Direct – traffic that arrived directly on a site without an apparent source (this may be users who know your website address or have saved it as a bookmark)
- Unassigned – traffic from a source that was not recognized by Google Analytics
See Google Analytics Help for the full list of Default channel groupings
The charts in the illustration above tell us that Direct and Organic search are the main sources of traffic to this website.
Below the two charts you will see more data represented as a table. The table is a frequently used data visualization tool in Google Analytics, and it is worth reviewing the features and data represented in this table to complete your understanding of Google Analytics 4 reports.
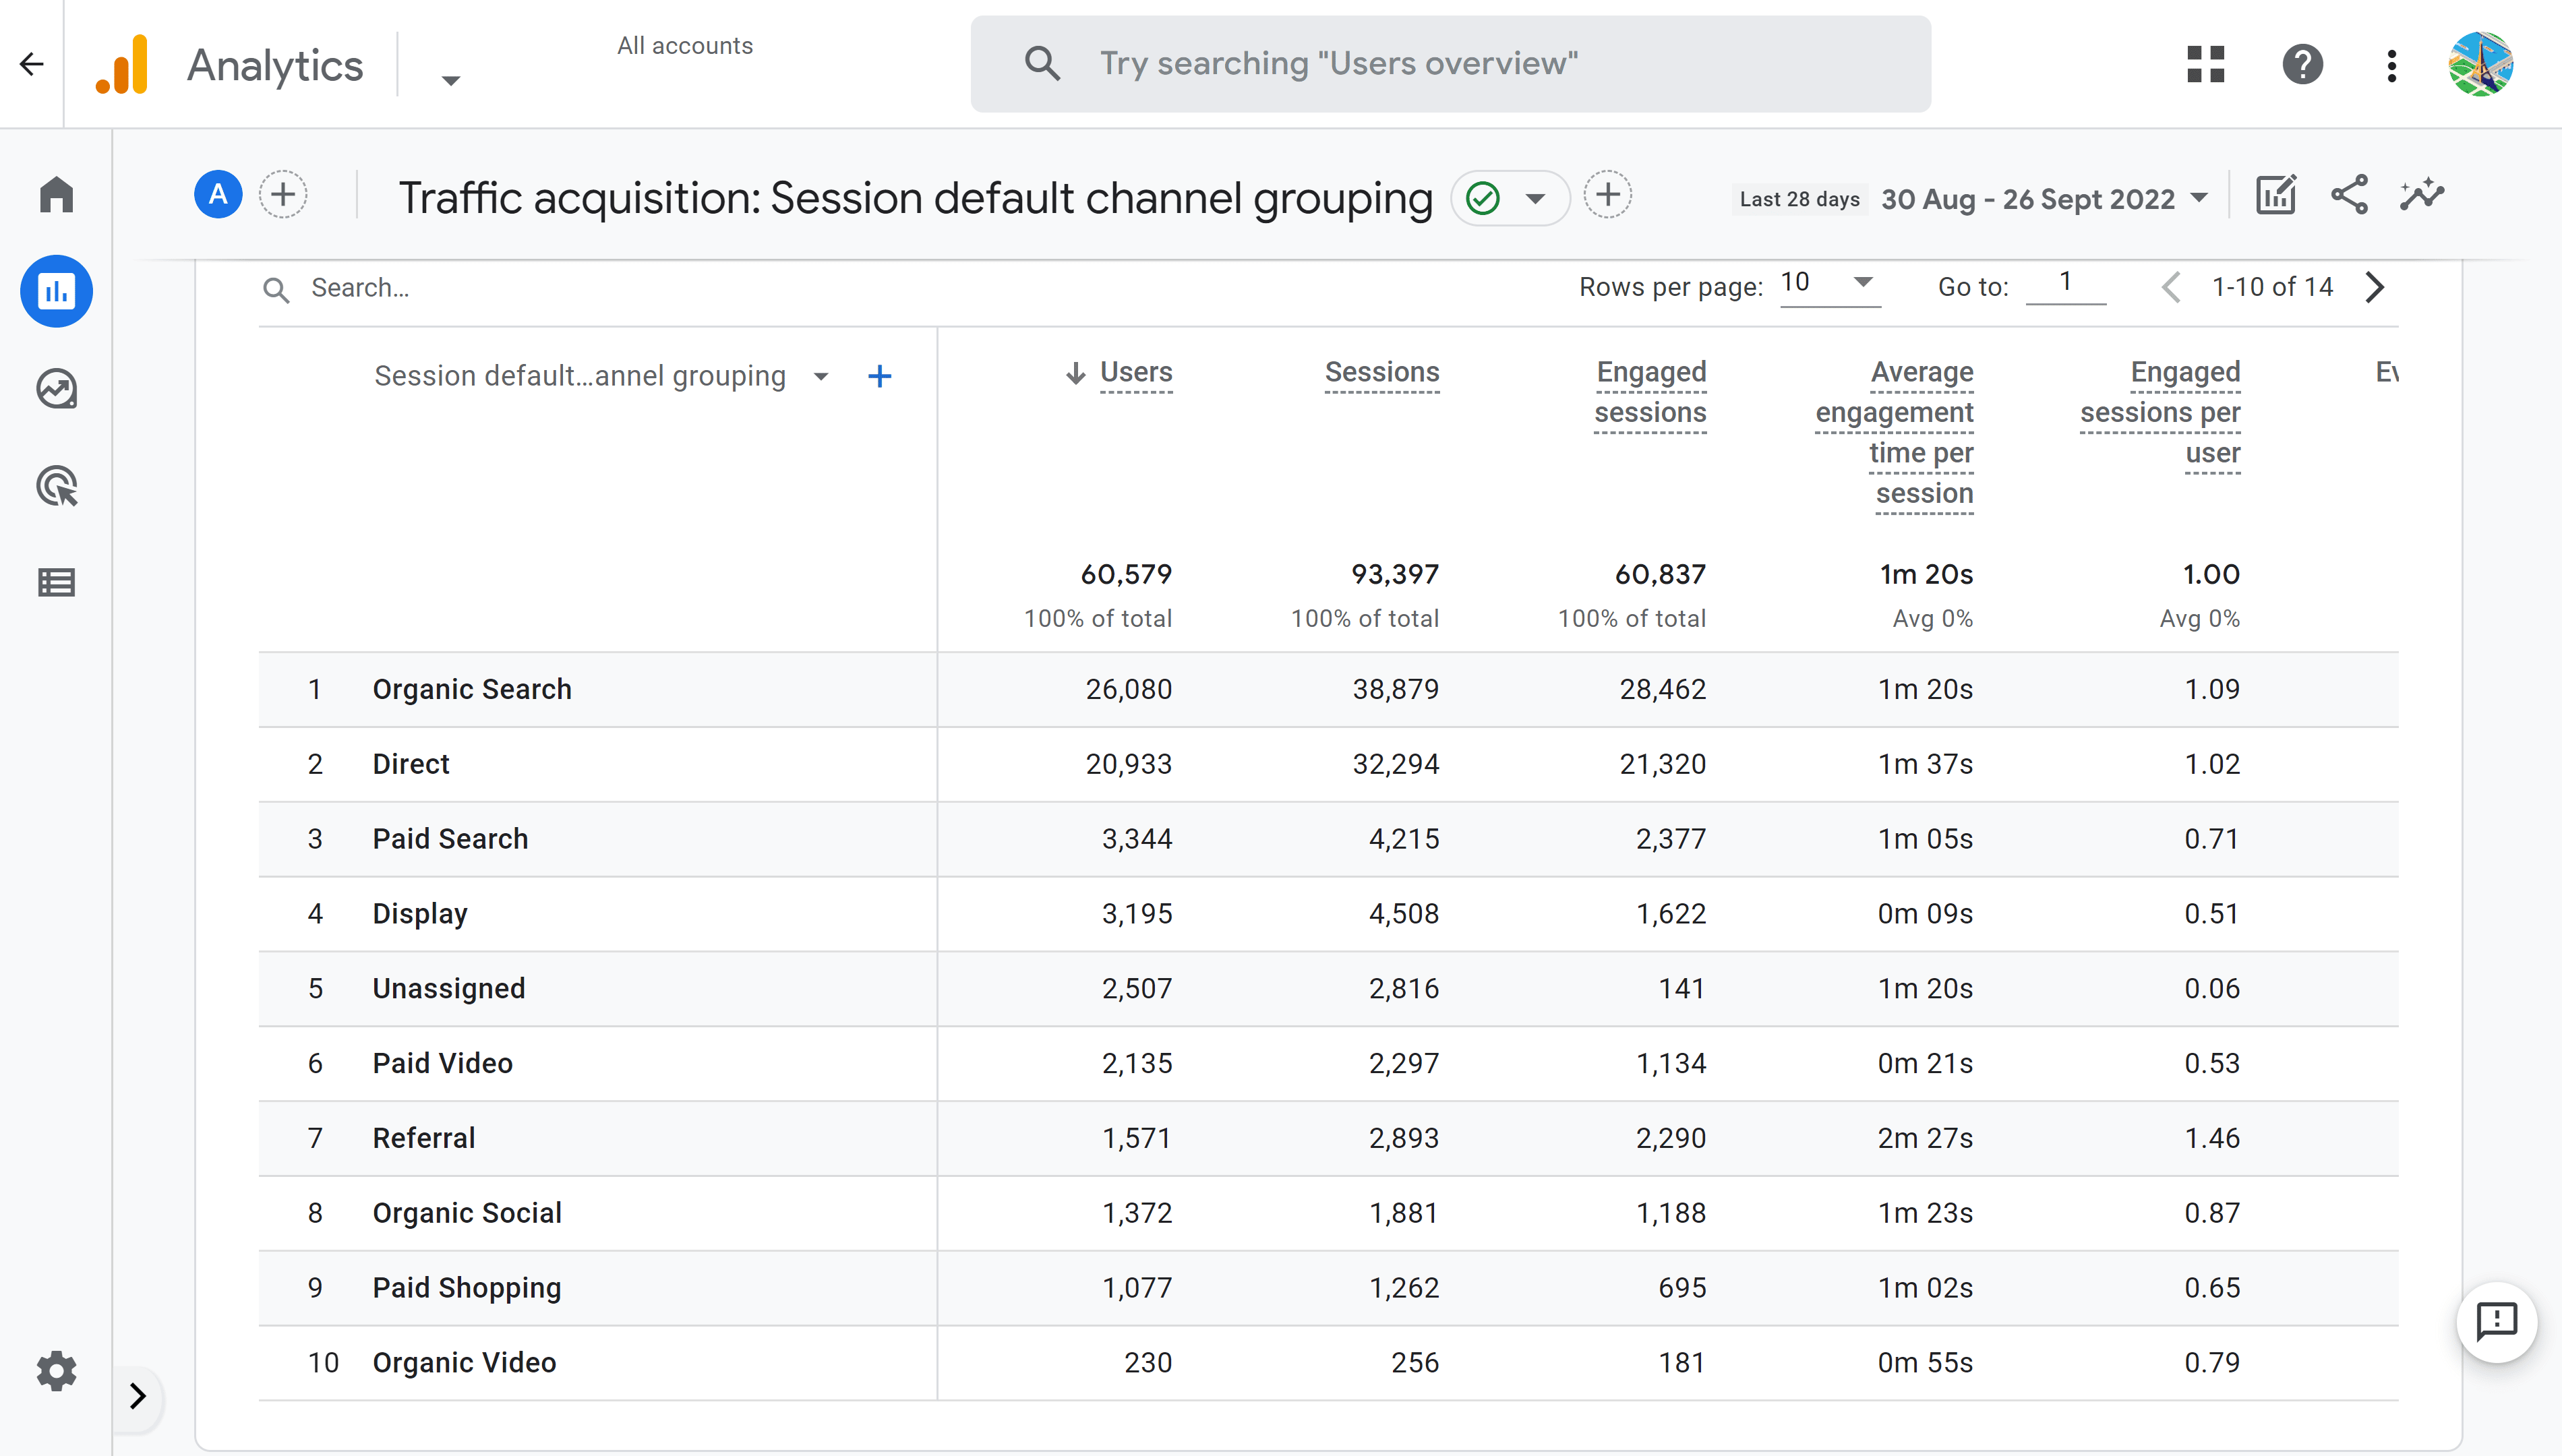
Like the charts featuring at the top of the page, the table shows data by “Session default channel groupings”. You can find a specific default grouping by using the search bar at the top of the table. Further along the top of the table you will see tools to adjust the number of rows in the table (by default there are 10) and to scroll through the “pages” of results. In the screen shot we can see that there are 14 rows so there are an extra 4 rows that are not visible in the table below. Click on the right arrow to view the last 4 lines. Click on the left arrow to come back to the first 10 rows.
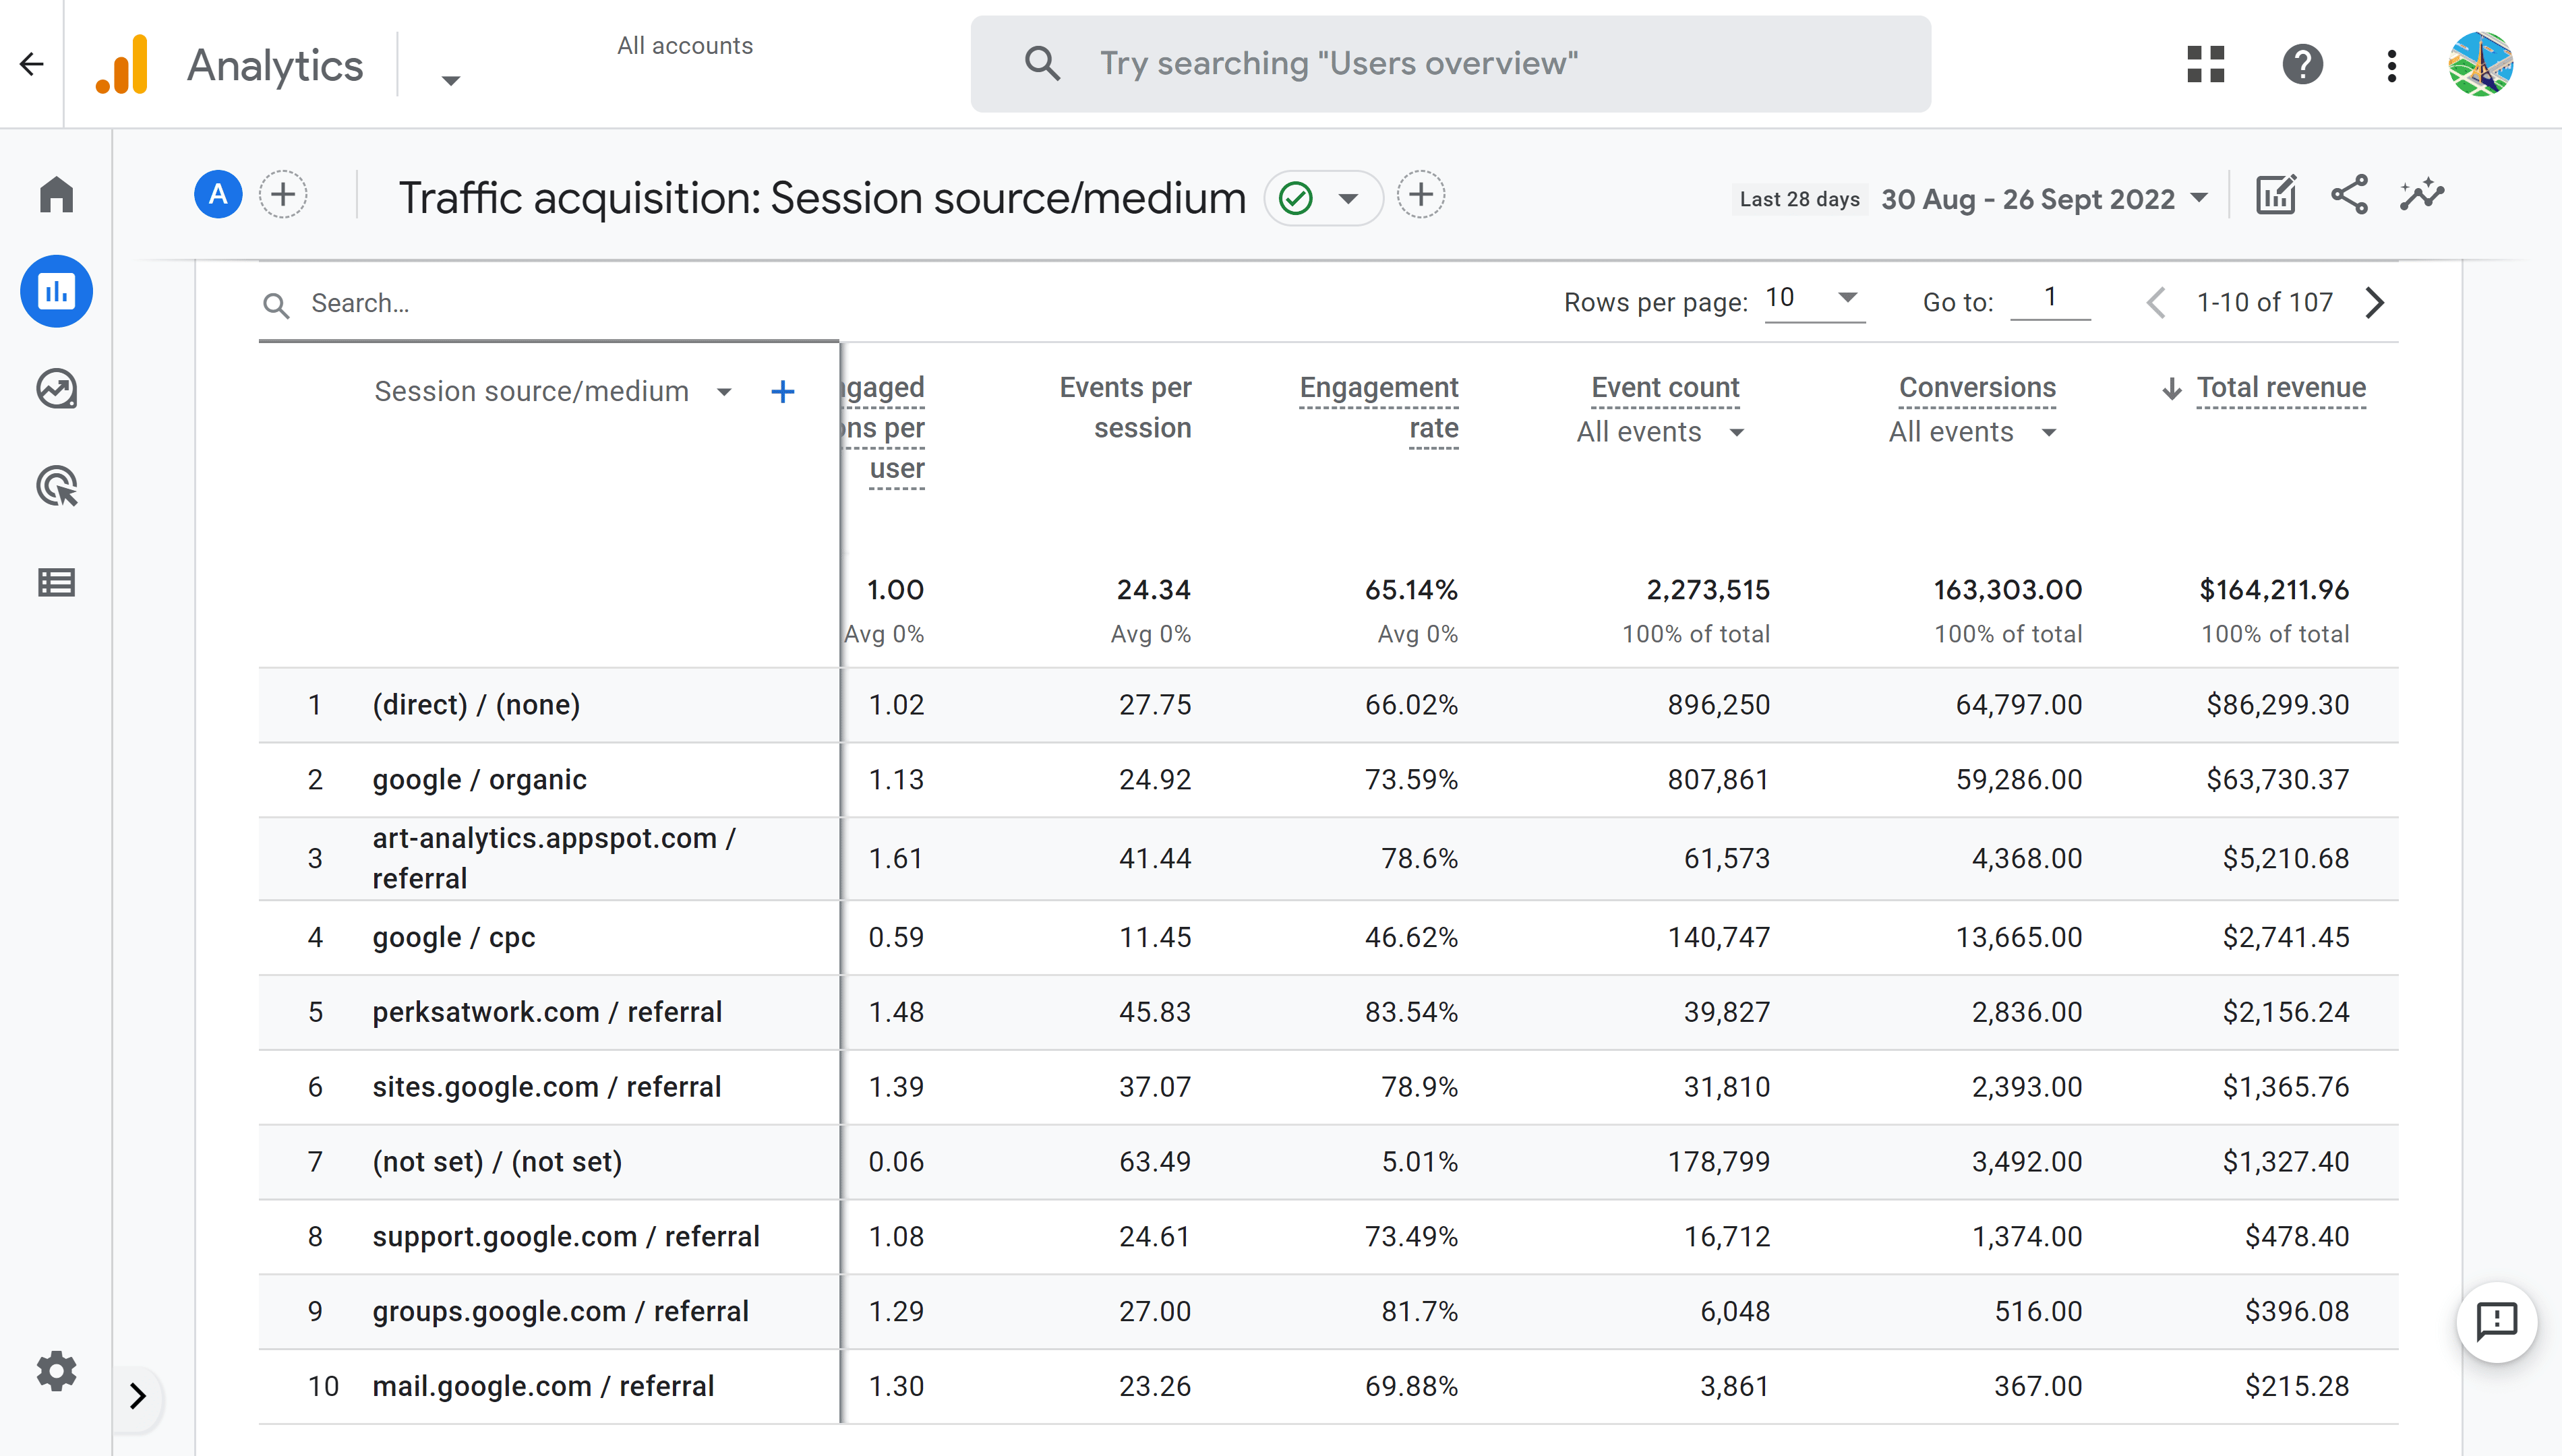
You can change the primary dimension of the table by clicking on the dimension picker below the search bar at the top of the table. For example, you could change the primary dimension to “Session source / medium” to see a complete list of traffic sources that are not grouped into channels.
Columns in this table are (you will have to scroll horizontally to see all columns)
- Users – this is the total number of individual users recorded on your site, bearing in mind that one user may have come to the site several times during the period
- Sessions – the individual visits to your site. A person who visits your site 7 times in a week will show as 1 user, but 7 sessions.
- Engaged sessions – If more than one event (such as viewing or scrolling on a page) is recorded during a session, the session is considered an engaged session. This important to analyze for paid traffic for example and the 3 following indicators are based on this number.
- Average engagement time per session – this can be interpreted as the average time a visitor spends on the web site during a session. We can note in the table shown in the screen shot above that the average engagement time for Display traffic is very low compared to other sources of traffic. Only 9 seconds per session compared to an average of 1m20s for all sources of traffic.
- Engaged sessions per user – this is the number of engaged sessions divided by the number of users. Values below 1 may be a sign of a low-quality traffic source.
- Engagement rate –the percentage of engaged session per session. Low values may be the sign that the traffic source is of poor quality and can be important to analyze for paid traffic in particular.
- Event Count – the total number of events recorded. A selector below the column title allows you to show data for just one event type.
- Events per session – the average number events recorded per session.
- Conversions – the number of conversions recorded. A selector below the column title allows you to show data for a specific conversion if you have more than one.
- Total revenues – for a site that has monetary values for conversions – such as an eCommerce site – this column shows the total amount of revenues generated per traffic source. This may be the most important column for your website to evaluate the return on investment in advertising or SEO efforts.
You can click on any column header to sort the table by the values in that column. For example, click to the left of the column title Total revenue to order the sources of traffic by revenue.
Now that you have learned about the major features of Google Analytics reports you can click through the other reports in the Reports menu. Popular reports you may want to explore now are
- Reports > Life cycle > Engagement > Pages and screens – this report details the number of visits to individual pages of the website and can help identify the most and least popular content. By filtering this data on traffic from Google you can find your most popular data
- Reports > User > Demographic Overview – this report breaks down users by geographic and demographic data. Geographic data includes Country and City. Demographic data includes Gender, Age and Interests.
Google Analytics Insights
The standard reports in Google Analytics probably answer most of the questions you wanted to ask about your site’s visitors. If you are still looking for answers, you may want to try Insights.
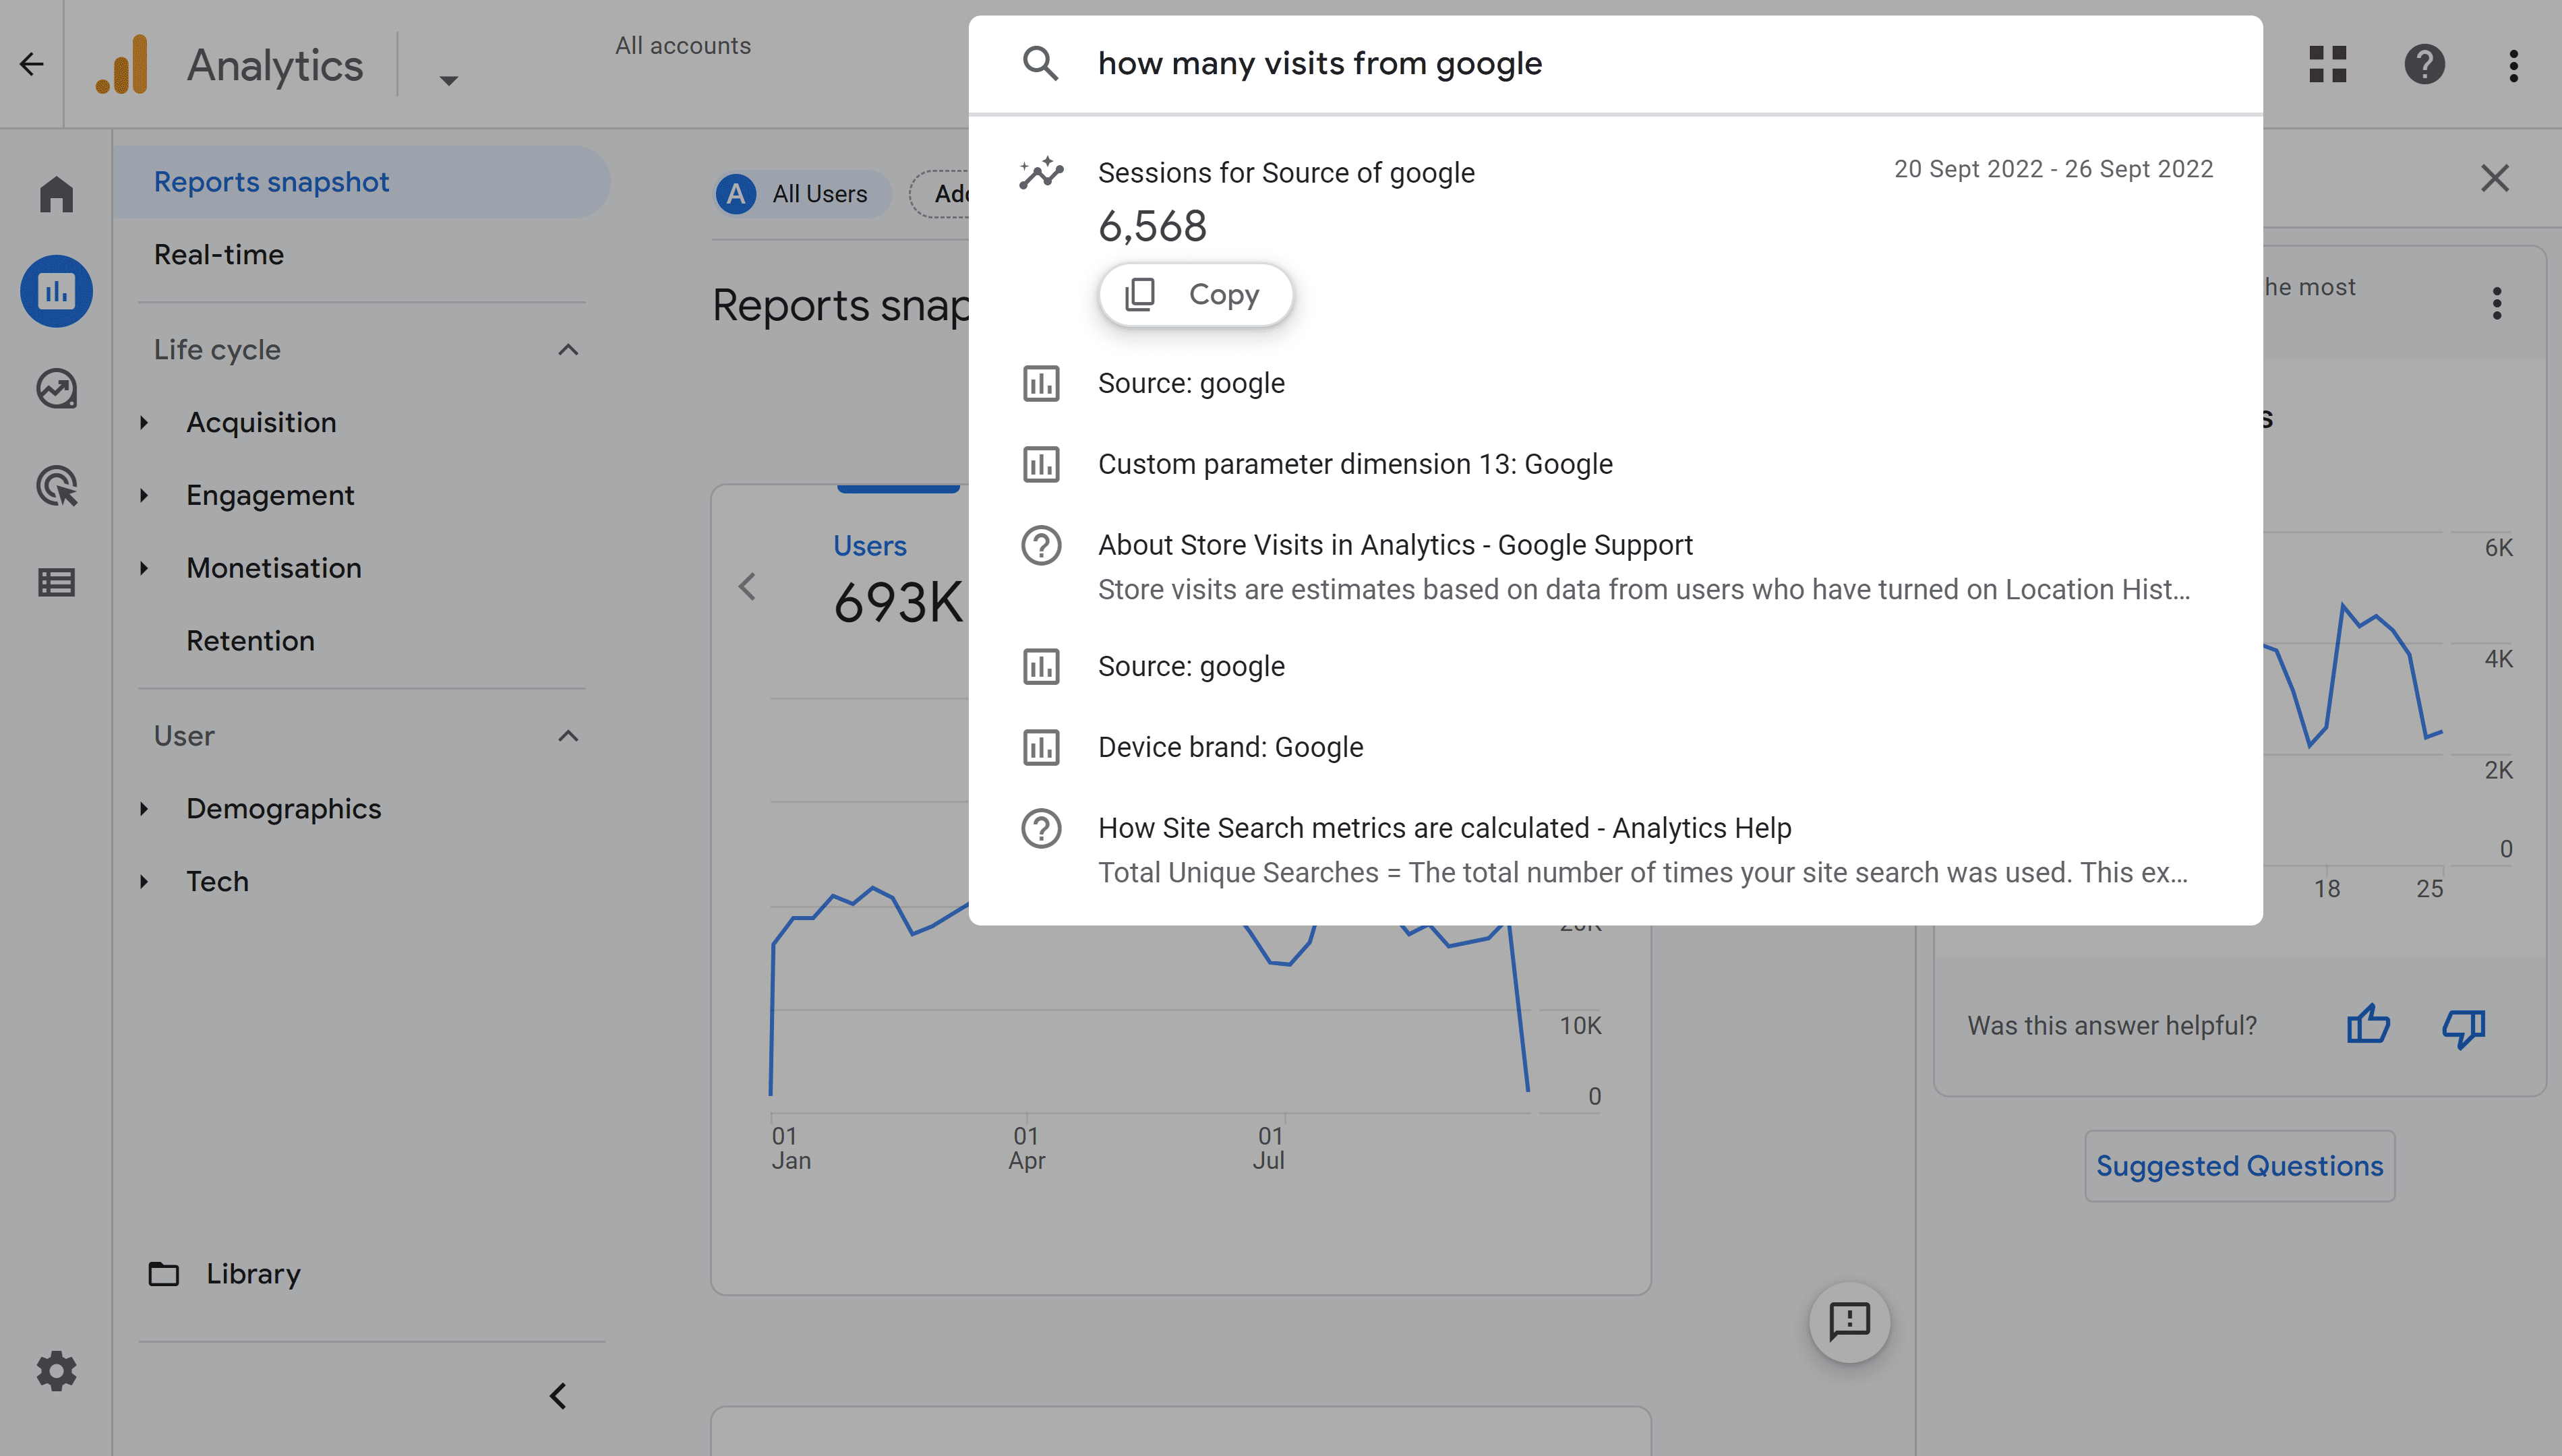
This is the promise from Google to answer your questions by simply letting you type it into the search bar at the top of any Google Analytics screen. Simply enter your question to get the answer or be guided to the appropriate reports. For example typing “How many visits from Google?” prompts Google to show an answer (6568) and links to the most appropriate reports and help pages.
Conclusion
Hopefully by following this guided tour of Google Analytics reports you will have learned the most important features of this new data analytics tool and you will have also learned a lot about your traffic. Was Google one of the major sources of visits to your website? For most sites it is. This underlines the importance on improving your SEO.
After Google updates or optimizations that you perform on your website using SEOPress, you can come back to Google Analytics to review your traffic and see if it has improved in both quantity and quality.
To make sure that you see the most important data from Google Analytics every day, add the Google Analytics dashboard to WordPress using SEOPress PRO.


