Ecommerce sites need traffic to generate sales. Traffic can come from search engines through SEO, text ads or shopping ads. It can come from social networks such as Facebook, directory sites or price comparison websites. You can also send newsletters to past clients to generate sales.
In many cases, traffic will cost money and, like a lot of advertising, some ad spend will be efficient and some will, frankly, be a waste of your money. Wouldn’t it be wonderful to know which was which? Even beyond paid ads, wouldn’t it be great to evaluate the performance of your marketing efforts more than just wetting your finger and sticking it in the air?
Ecommerce solutions for WordPress like WooCommerce will report on total orders and sales, but they rarely give accurate information on the sources of sales or the different sessions visitors have on your site before buying.
Fortunately, you can use Google Analytics to get this sort of detailed insight into how sales are generated. You can drill down to different traffic sources and campaigns and even attribute sales to sources that were not the last one to bring a visitor to the site before they purchased.
Google provides two types of Ecommerce tracking: Standard and Enhanced.
To get Enhanced Ecommerce reports you need to either use the gtag.js implementation of Google Analytics or add the ec.js library to analytics.js code. In both cases extra code is needed to send information on visits to product and cart pages. This code records shopping cart contents and sends them to Google Analytics.
Enhanced Ecommerce reports for WooCommerce
WooCommerce doesn’t integrate Google Analytics code by default – you will need another plugin. Good news, SEOPress PRO ($49) adds Enhanced Ecommerce tracking to WooCommerce sites using gtag.js. The first version is a beta and will let you measure purchases, add to cart events and remove from cart events. Over time, it will be improved to give access to more Enhanced Ecommerce features and support other Ecommerce solutions for WordPress like EDD.
Bad news: Google Analytics is not accurate
Now the bad news. Although it is more of a forewarning. Google Analytics measures users by firing javascript code as pages load and storing cookies on your visitors’ computers or phones. And things can go wrong, browsers could block scripts or cookies. Google may not see all your visits or orders.
So, although Google Analytics will give you are great insights into your digital marketing performance, do not expect them to be 100% accurate.
You are very likely to see a difference in the number of orders and total sales compared to figures in the WooCommerce Analytics dashboard. If you are seeing less than 80% of orders in Google Analytics, there may be a problem in the installation of the Google Analytics tag – or you may have an external payment solution that is not sending users back to the site to confirm the sale. It is worth spending some time to make sure that you are collecting as much data as possible, but if they are small differences you may just have to accept it as normal.
Also bear in mind that Google cannot see when sales are cancelled or modified manually through the WooCommerce dashboard. It only records visits to the front end of the site.
Ecommerce as a KPI
When you activate Ecommerce reports in Google Analytics, you can add Ecommerce KPIs to many existing reports. For example, in the Audience > Mobile > Overview report you can see the difference in sales by user device (mobile, desktop or tablet). Google reports the number of orders as “transactions” and the total sale value as “Revenue”.
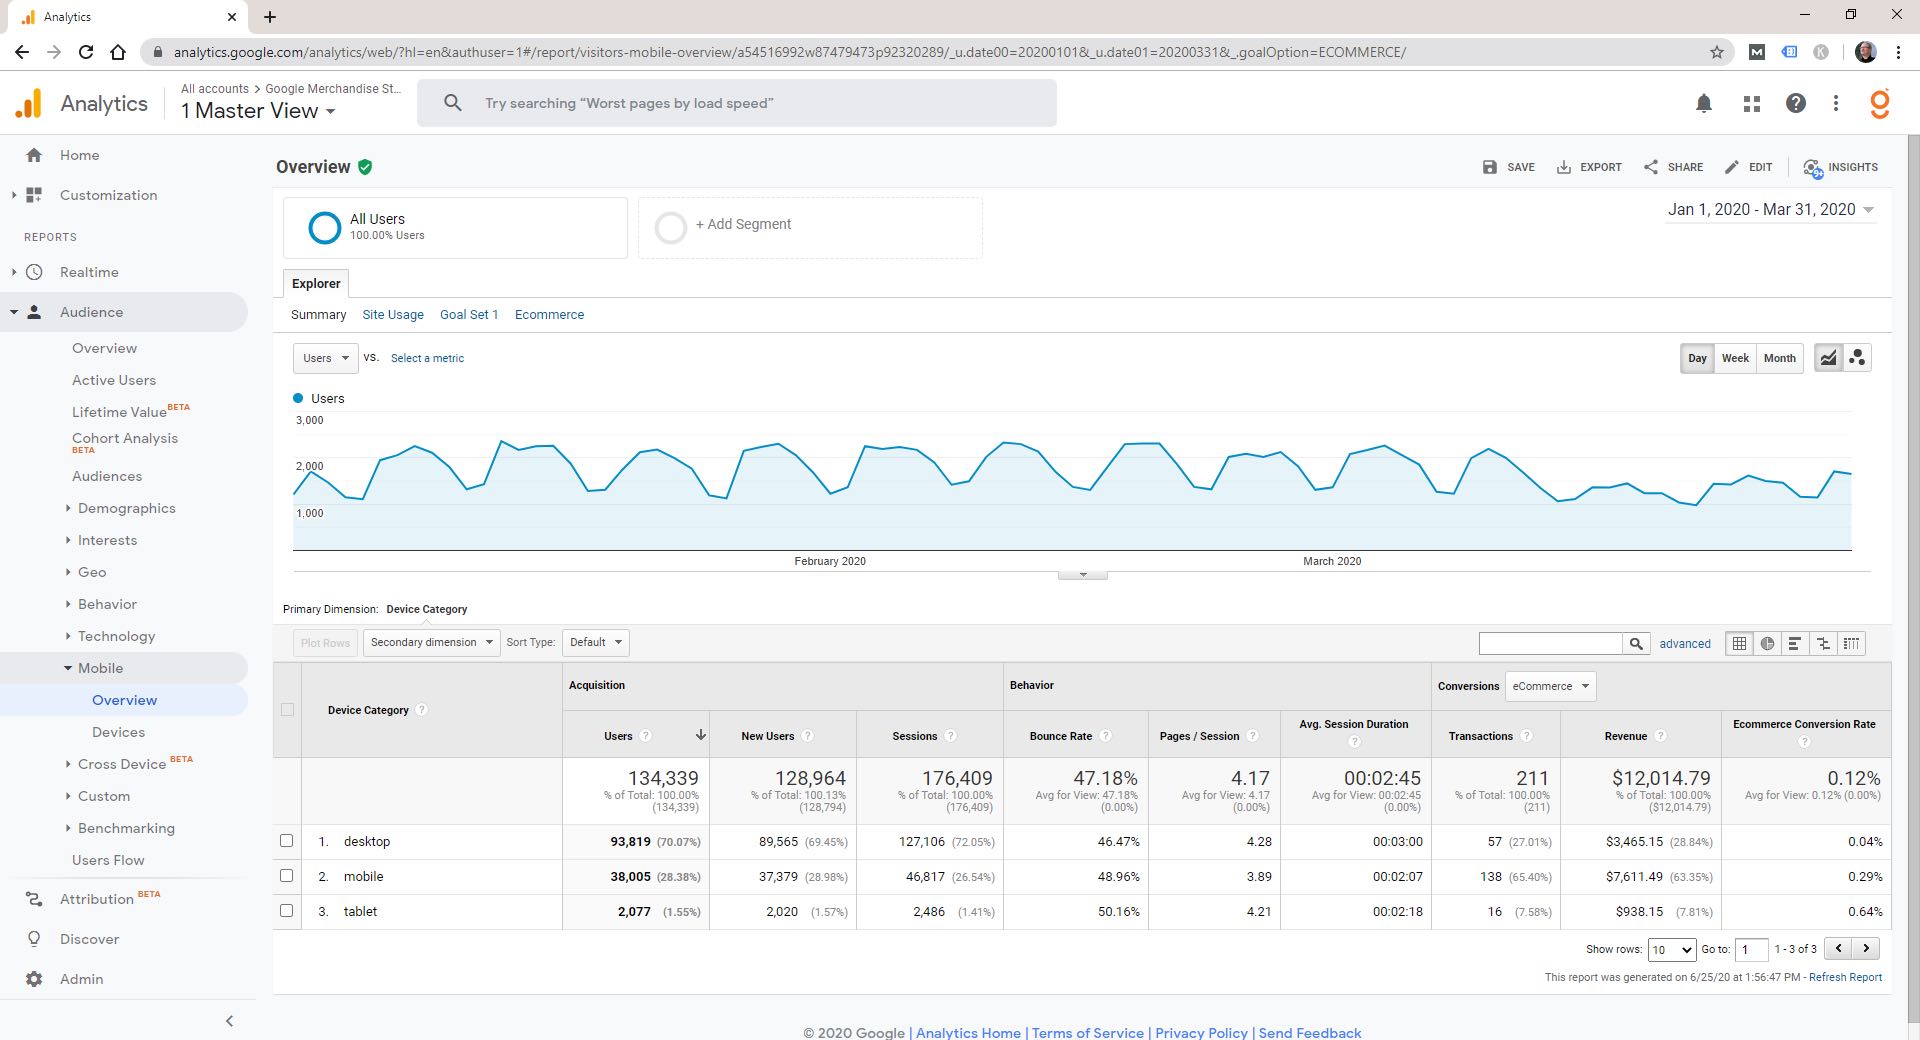
You also get a really interesting metric here: Ecommerce conversion rate – the number of transactions divided by the number of sessions. In this example the conversion rate on desktop is 0.04 % and the conversion rate on mobile is 0.29 %. Visitors using mobile devices are more likely to order on this site.
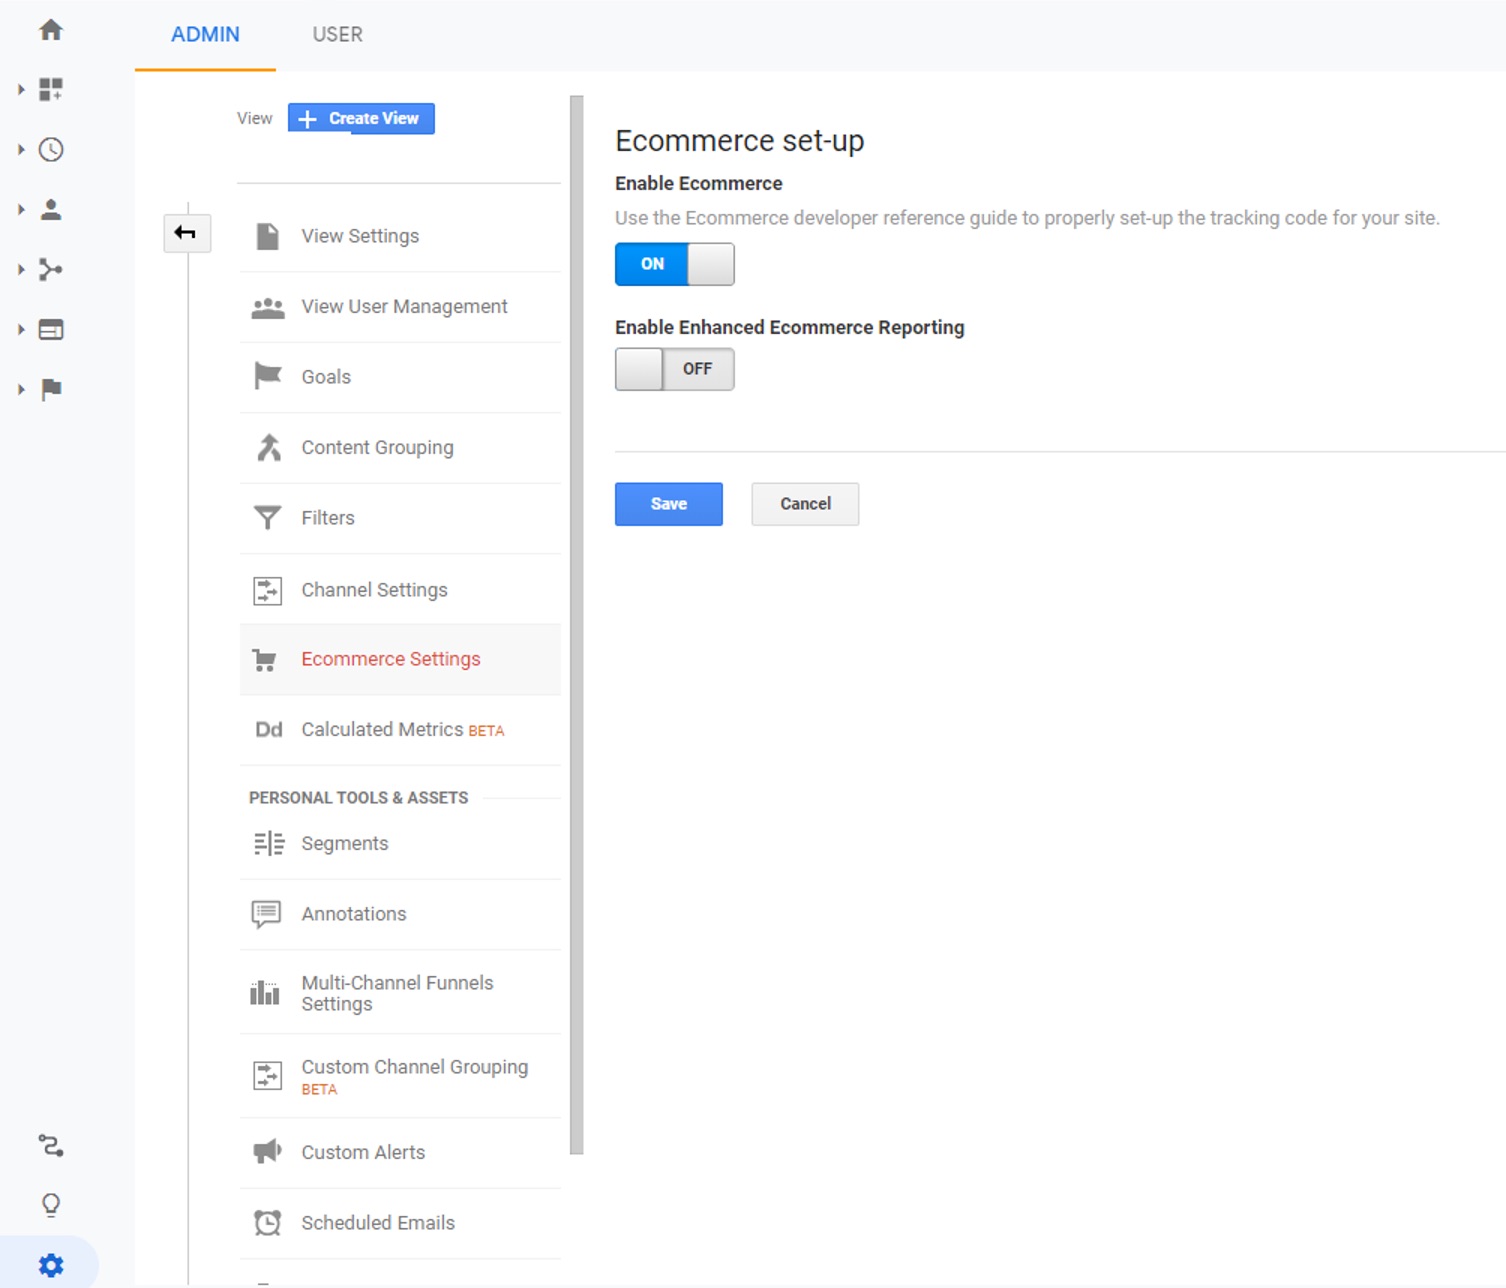
If you cannot see the Ecommerce columns in your report, you may need to select “Ecommerce” in the conversion drop-down. If you don’t have this option, you need to go to Admin > View > Ecommerce Settings and make sure you have Ecommerce Set Up enabled.
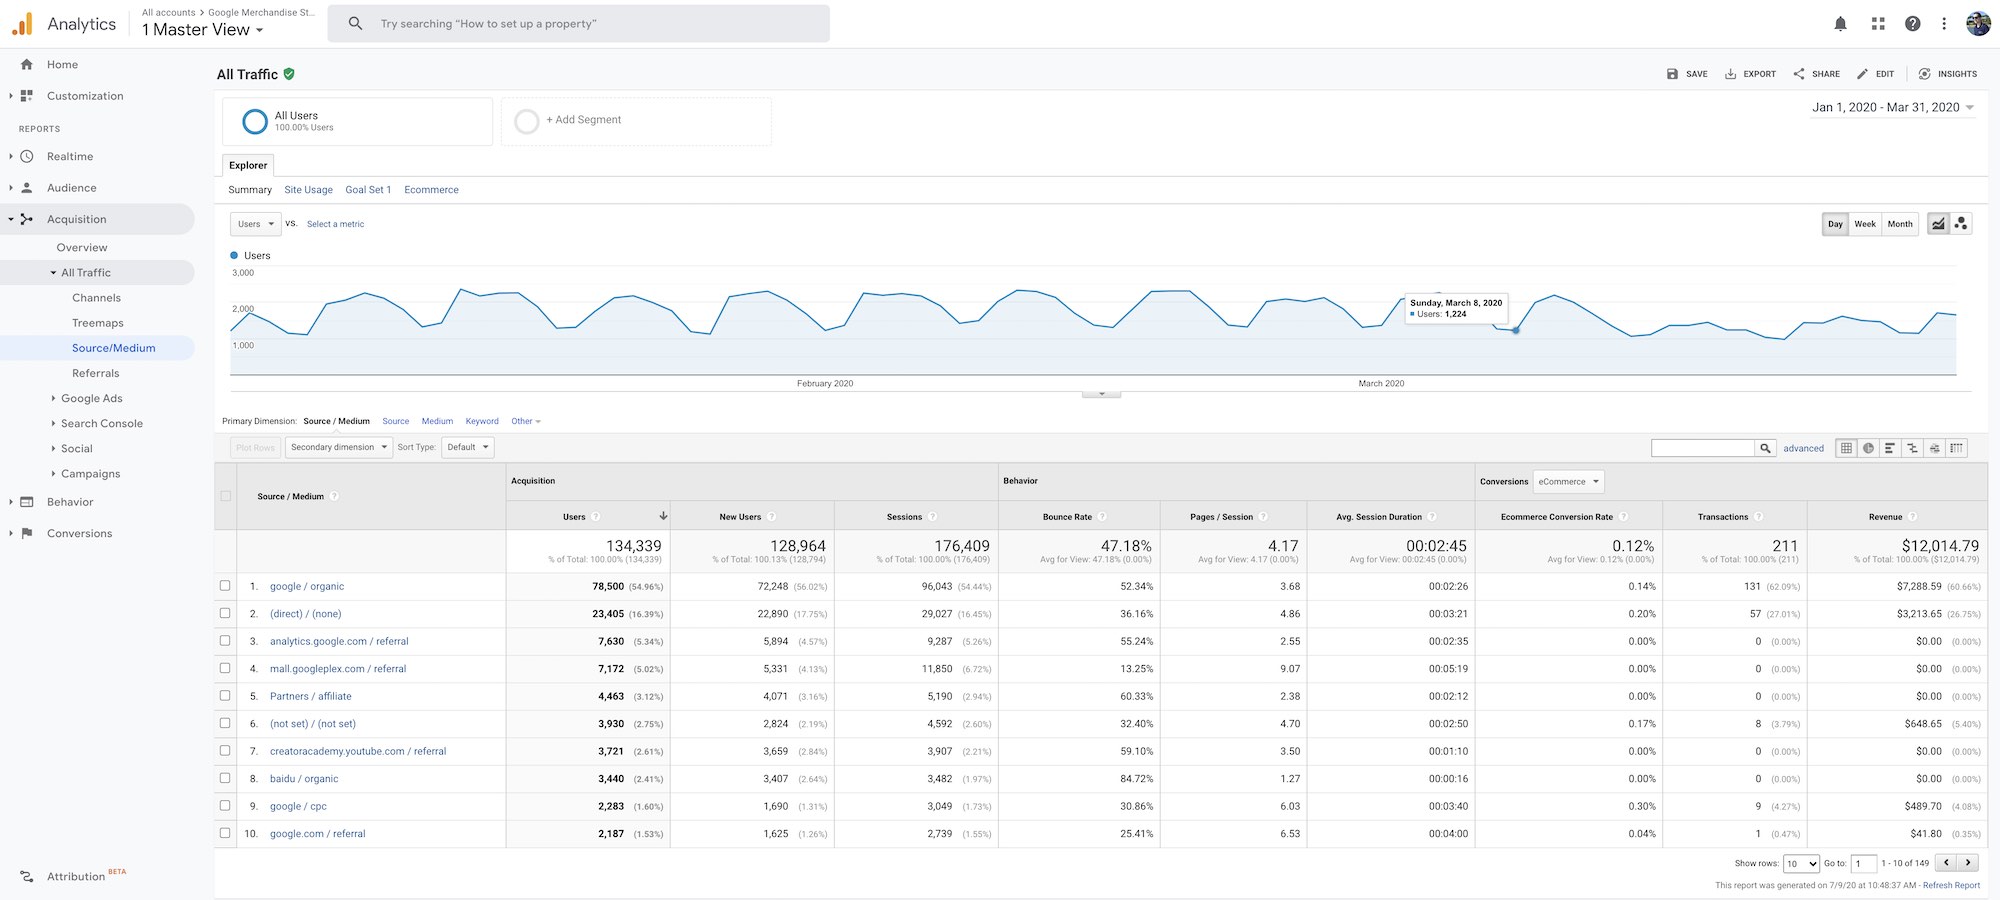
In the Acquisition > All traffic > Source / Medium report you will get detailed information on what traffic sources generate sales.
In this example “google / organic” (organic traffic from Google) is the top source of sales. 98,034 sessions generate 131 sales giving an Ecommerce conversion rate of 0.14%.
In the Behavior > Site Content > Landing Pages report you can see traffic per landing page (ie the pages that visitors arrived on first during their session) that lead to sales.
And in the Behavior > Site Content > All pages report you can see the number of pageviews along with another interesting Ecommerce KPI: Page Value. Page Value is the Transaction Revenue generated by sessions that viewed that page before purchasing divided by Unique Pageviews.
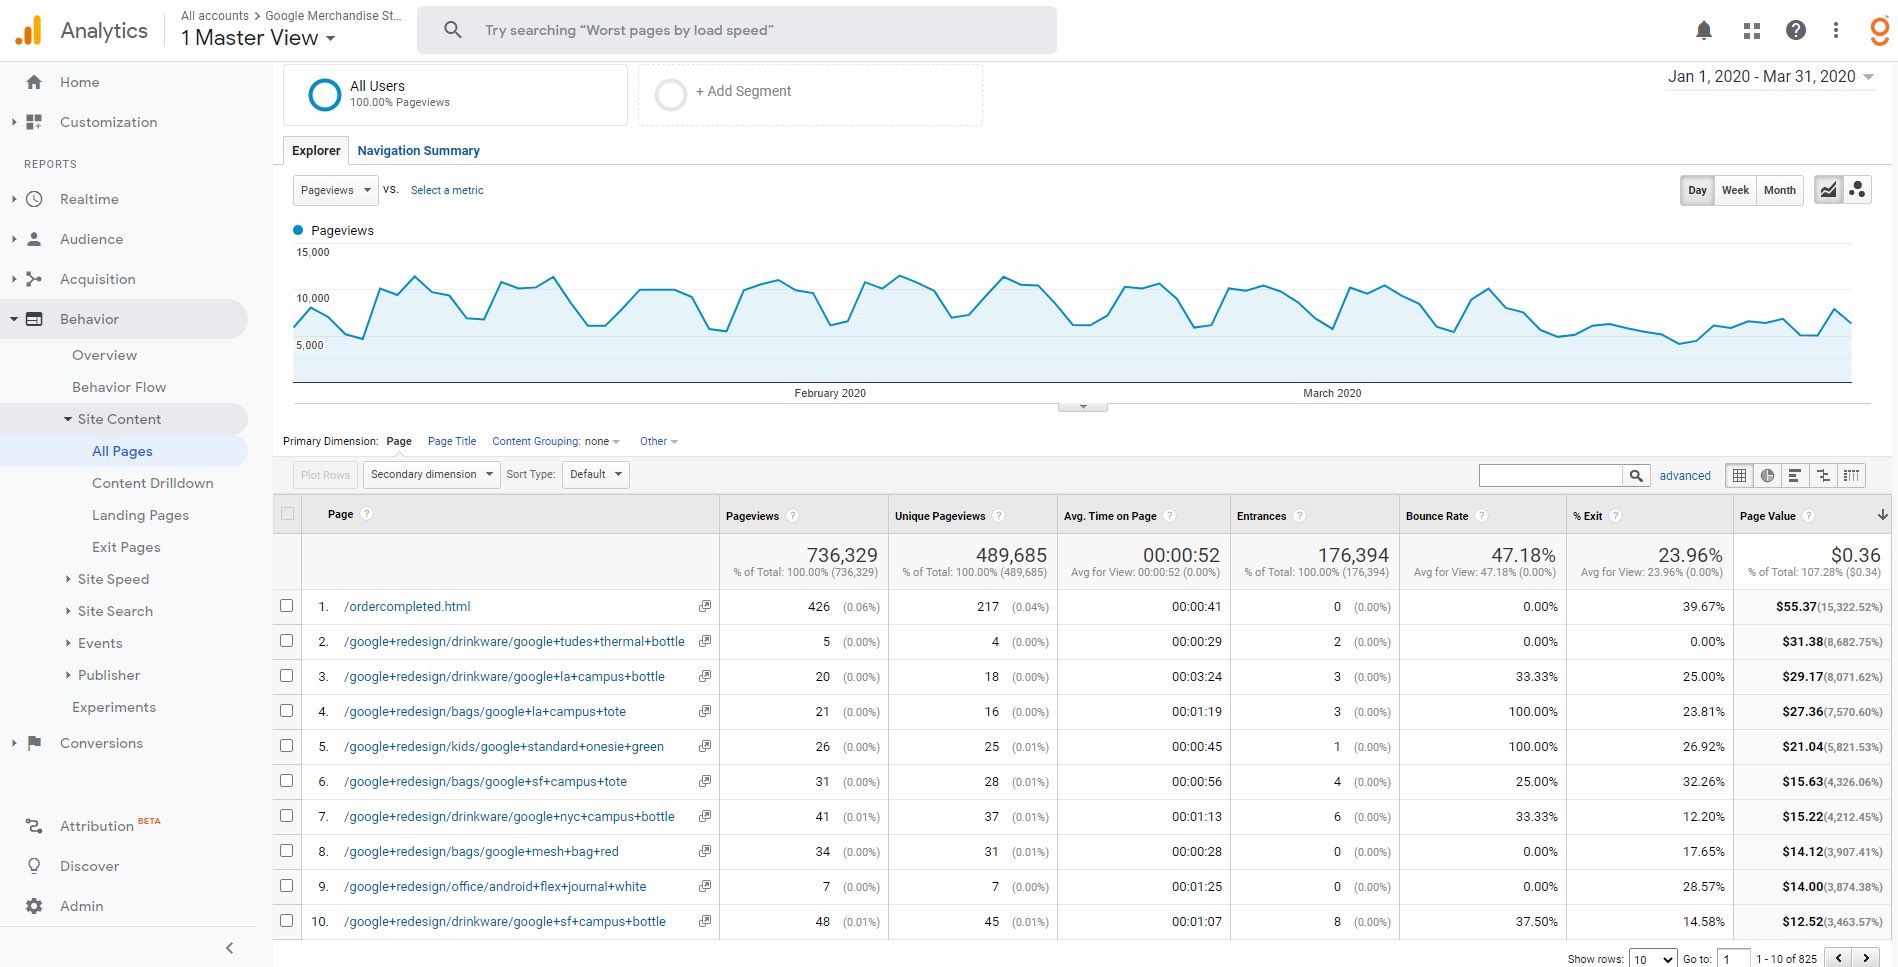
It gives you an idea of what your most valuable pages are. Increase traffic to these pages and you should increase revenue.
Standard Ecommerce reports
Specific Ecommerce reports can be found in the Conversions menu of Google Analytics. From the Overview page you will be able to see sales over time as “Revenue” and “Transactions”. Google also calculates the Ecommerce Conversion Rate (Transactions / Sessions) and the Average Order Value (Revenues / Transactions). You can also see these values over time.
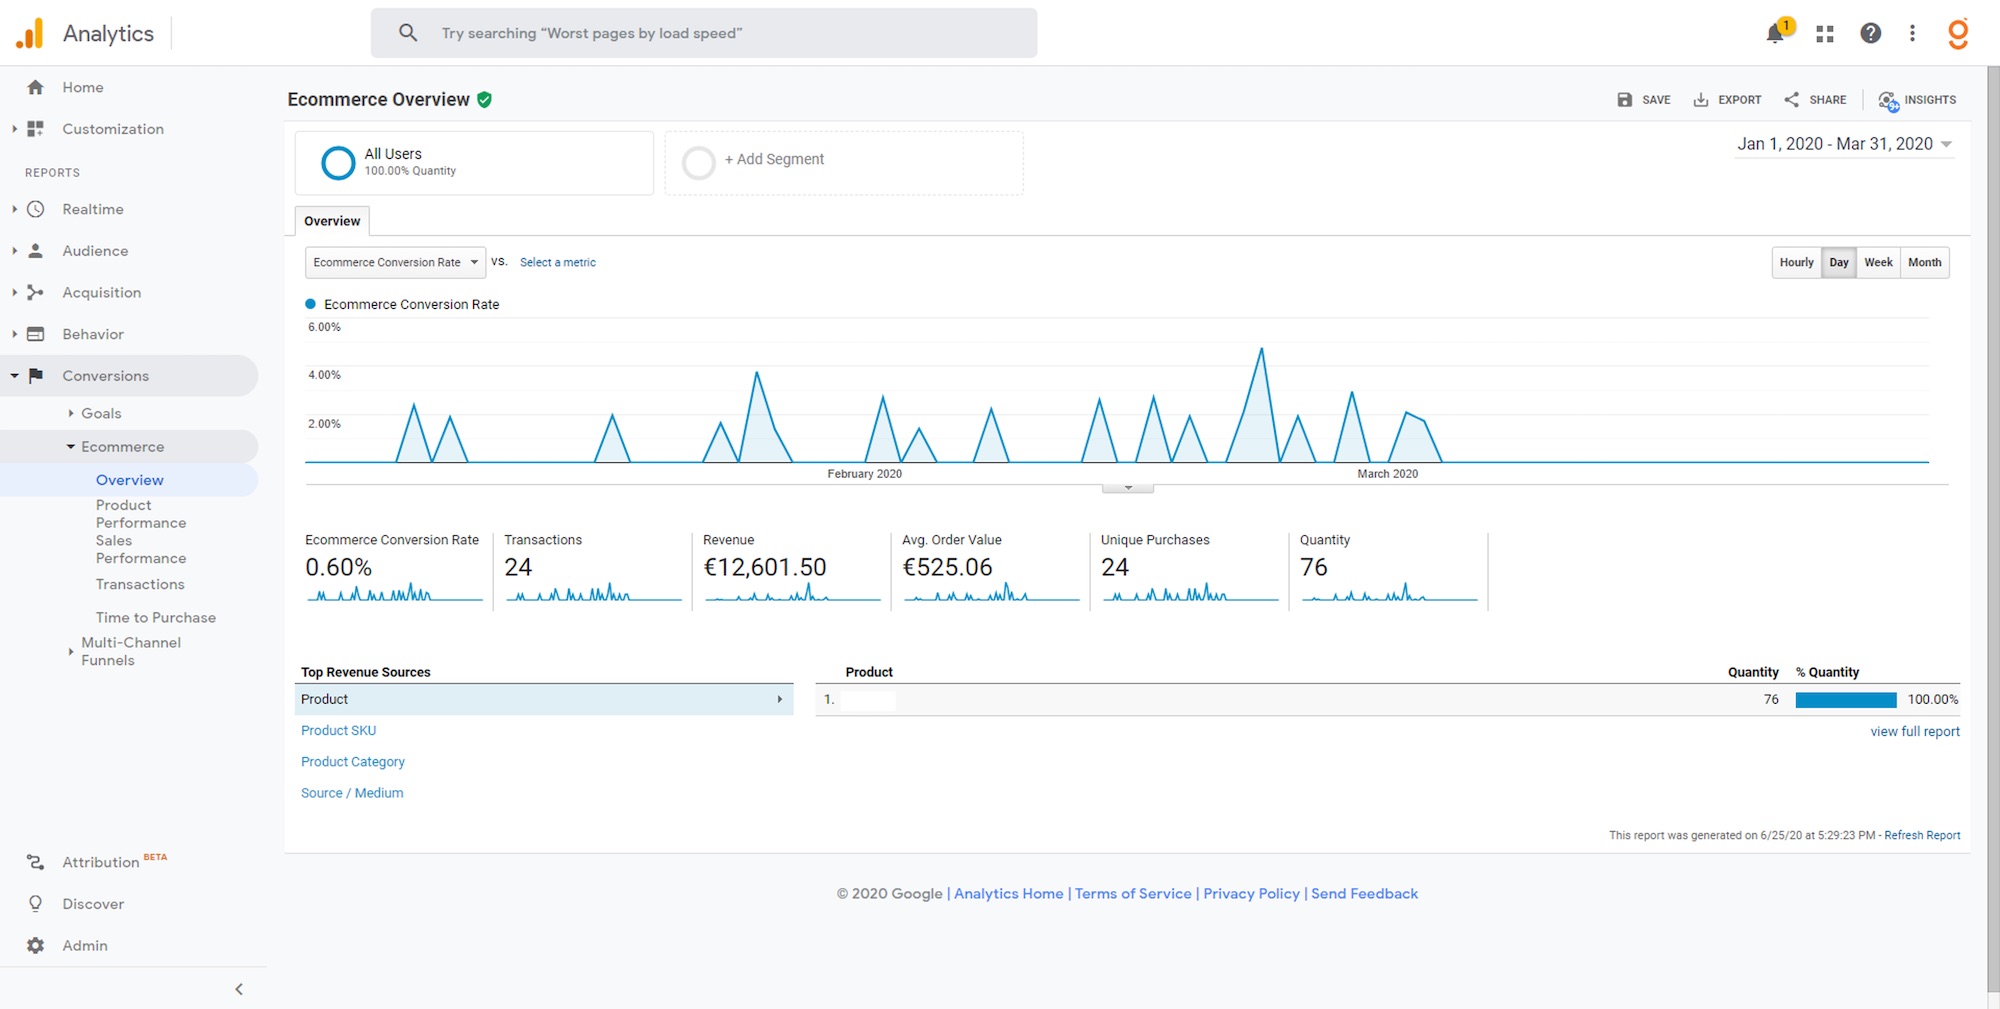
If your Ecommerce tag is correctly installed, you should also see the details of the different products bought (in this example there is just one product for sale).
Standard Ecommerce reports also include Sales Performance, Transactions (with details of sales using your internal order number) and Time to Purchase.
Advanced Ecommerce features
Using Advanced rather than Standard Ecommerce reports, you get a new dashboard and many new reports. It introduces the notion of “marketing” giving KPIs on campaigns, internal promotions, coupon codes and affiliation.
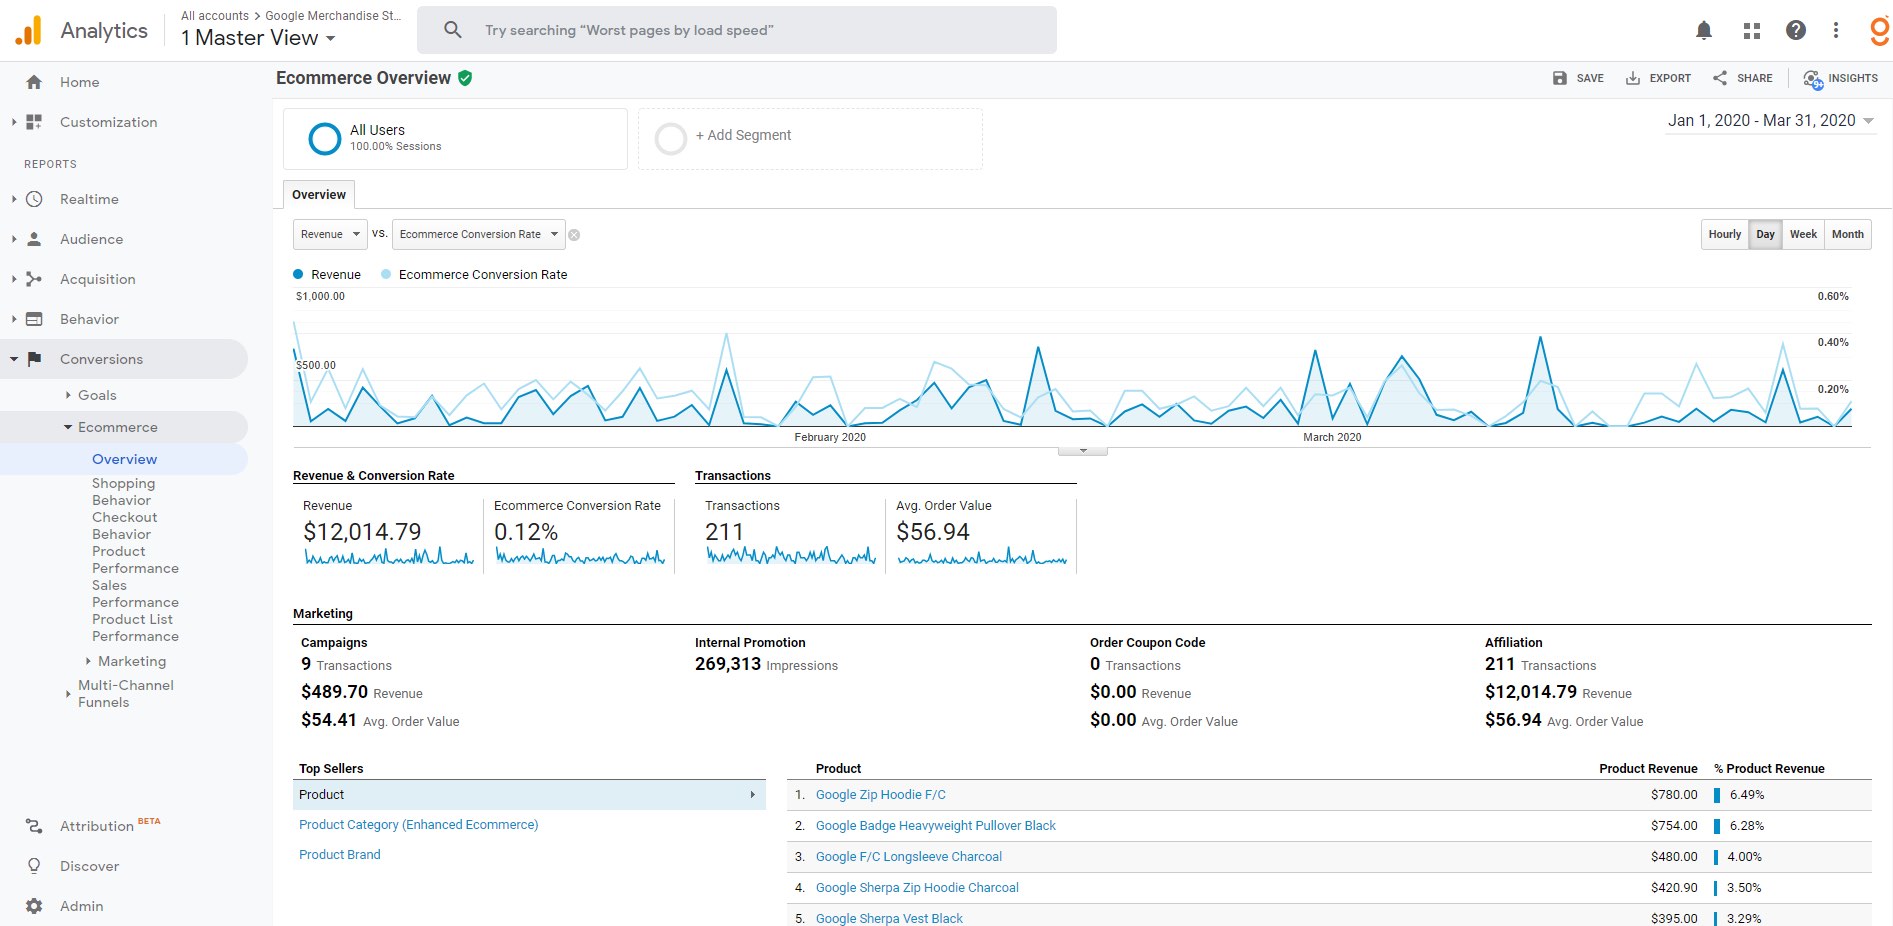
- The transactions, revenue and average order values associated with “Marketing” in this dashboard are the same as the KPIs in Acquisition > Campaigns > All Campaigns report (you can view this in Standard and Enhanced reports). Google Ads campaigns will be automatically recognized, but if you want to add campaign names from other ad platforms, you will need to add UTM codes to the URLs used in ads. See Google’s campaign URL builder.
- Internal Promotions is a report based on internal promotion codes you can add to banners or links within your own website (for example a slider on your homepage that promotes your Black Friday offers).
- The Coupon Code report can give you the detail on coupon, or reduction, codes used by clients.
- Affiliation reports can give you detail of which affiliate websites generated sales. By default you’ll see your own website as the sole affiliate.
To see relevant information in these reports you need to add data to the javascript tags used to send information to Google. A complete guide for developers is provided by Google.
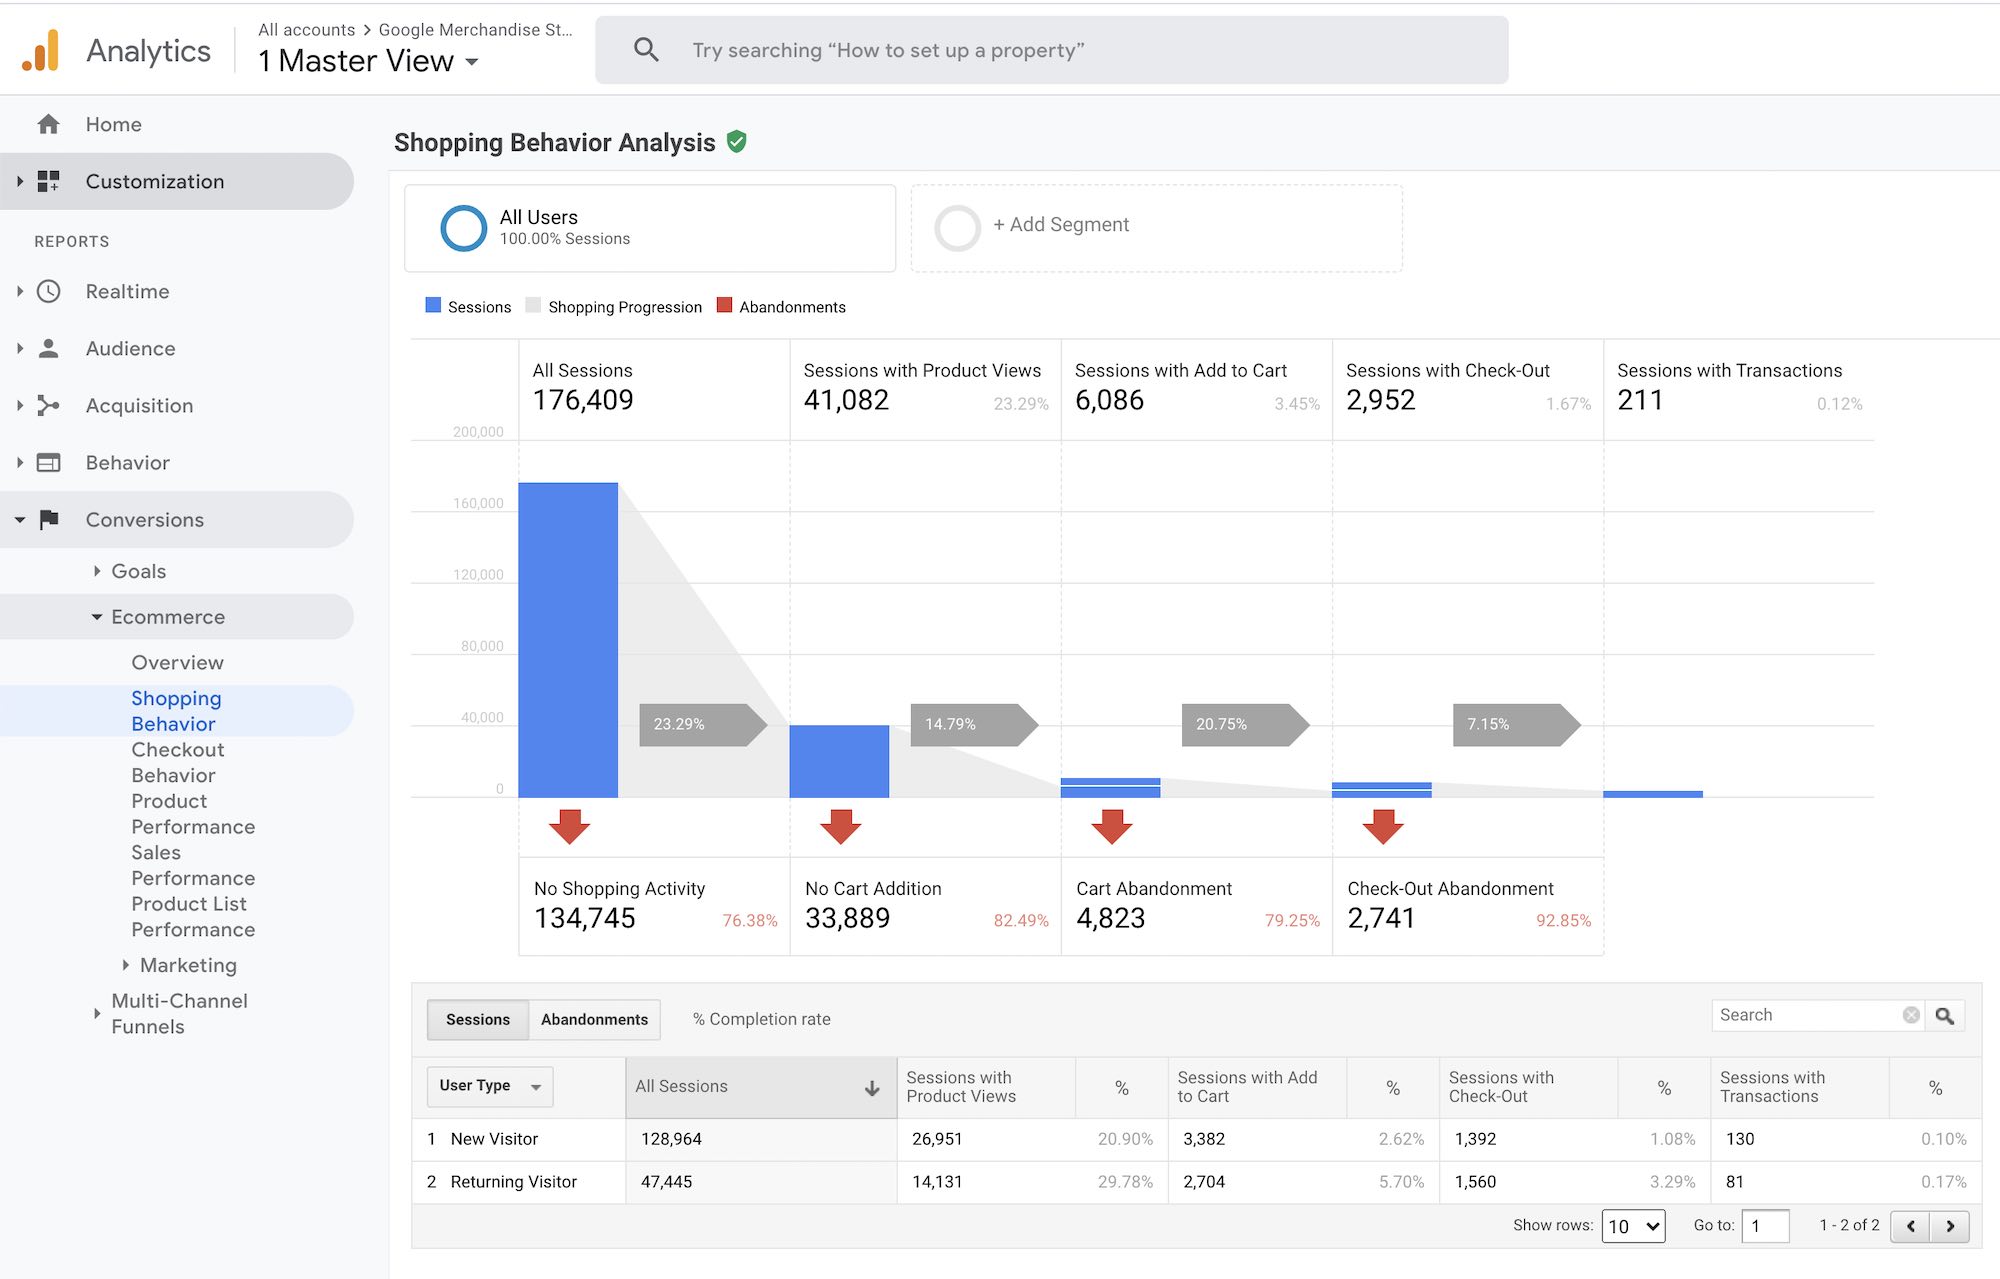
Enhanced Ecommerce adds new reports Shopping Behavior, Checkout Behavior and Product List Performance. Shopping Behavior columns are added to the Product Performance report.
Shopping Behavior Analysis shows detail of the sales funnel starting with all sessions and product views. You can list the results by different dimensions such as country, source, campaigns or custom dimensions.
Checkout Behavior Analysis shows the detail of the sales funnel once a user has added a product to the cart. Again with the possibility of listing results by different dimensions.
Why use Google Analytics Enhanced Ecommerce Reports?
As with many types of analytics data, Enhanced Ecommerce reports may help you find ideas to optimize your website and increase sales. For example, you may consider that 81% drop-off from the payment page needs urgent attention. You can add new payment methods or change the wording of the page to try and reduce the drop-off and increase the number of potential clients that go through the next step. The Checkout Behavior Analysis report will then help you see if these changes really reduced this metric.
And it’s not just a metric. Logically, if you reduce your drop-off at the payment page from 81% to 80% you are increasing sales by over 5% ; 100 visits to the payment page will generate 20 rather than 19 sales. Good website analysis makes you more money without needing more visitors.
Google Analytics demo site
Many of the Google Analytics screenshots used to illustrate this article come from Google’s own demonstration account. See more information here on how to access this property from your Google Analytics account. It is a great resource for students who do not have access to live Ecommerce data.
